Figures & data
Figure 1. Average market exclusivity period by year of first generic entry, new molecular entities. Source: IMS Health data on all new drugs with initial generic entry in the period 1995 through December 2014. Notes: New molecules with sales greater than $250 million based on sales in the year prior to generic entry and inflation -adjusted to 2008 dollars using the Consumer Price Index for All Urban Consumers.
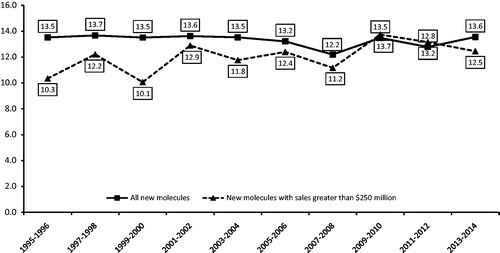
Figure 3. Paragraph IV filing frequency and timing; (a) all NMEs; (b) NMEs with sales >$250M (3-year moving average). Source: IMS Health data on all new drugs with initial generic entry in the period 1995 through December 2014. Food and Drug Administration data and general public information sources on Paragraph IV challenges. Notes: All numbers are three-year moving averages.
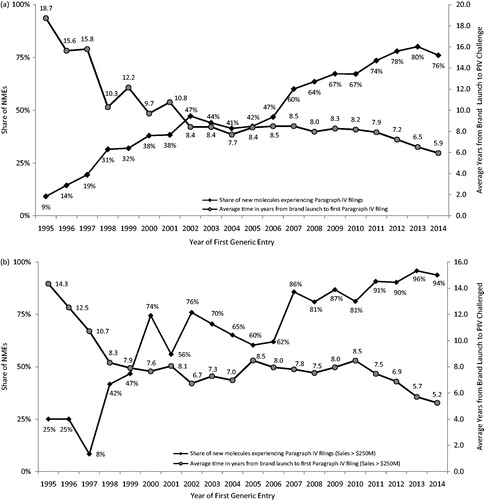
Table 1. Average market exclusivity period by year of first generic entry.
Figure 2. Average number of generic entrants within 1 year of first generic entry, new molecular entities. Source: IMS Health data on all new drugs with initial generic entry in the period 1995 through December 2014. Notes: New molecules with sales in the year prior to generic entry, inflation-adjusted to 2008 dollars using the Consumer Price Index for All Urban Consumers.
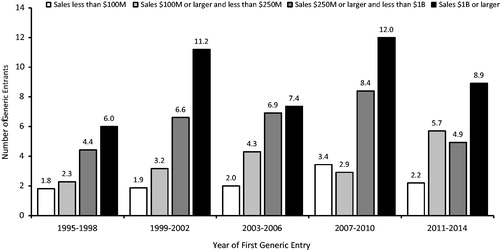
Figure 4. Paragraph IV challengers by year of first generic entry, 2004–2014. Source: MEP dataset, ParagraphFour.com, authors' calculations.
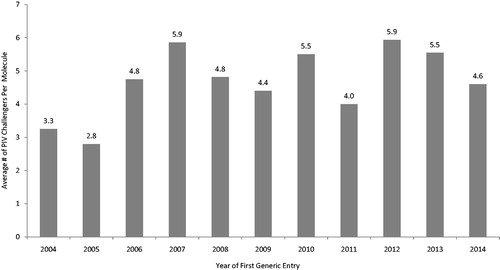
Table 2. Paragraph IV filing frequency, timing, and number of challengers.
Table 3. Determinants of Paragraph IV filing frequency and timing.
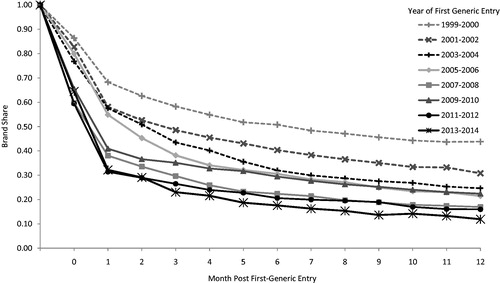
Figure 5. Average monthly brand share of standard units of the molecule/form following first generic entry. Source: IMS Health data for all new molecular entities with first generic entry in the period 1999 through December 2014. Note: Initial generic entry occurs at some point during month “0”. Month “1” is the first full month of generic competition.