Figures & data
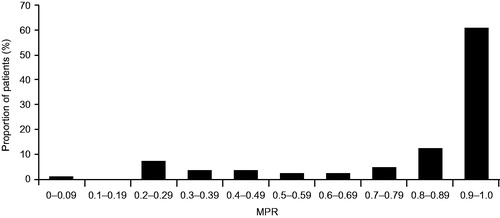
Figure 1. CONSORT diagram showing patient selection. IP, inpatient; OP, outpatient; CF, cystic fibrosis.
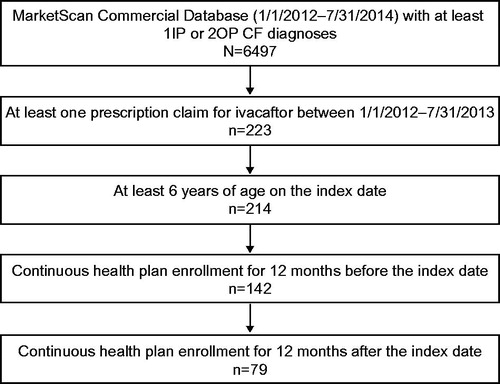
Table 1. Baseline demographic characteristics.
Table 2. Clinical characteristics and medications within the 12-month pre-index period.
Table 3. Healthcare resource utilization.
Table 4. Ivacaftor treatment characteristics during the post-index period.
Figure 2. Medication possession ratio by deciles. MPR, medication possession ratio; total days supplied from all ivacaftor refills divided by 365 days of the post-index period.