
Figures & data
Table 1. Demographic characteristics.
Table 2. Correlations between demographics and severity.
Figure 1. Predicted health-related quality-of-life. Note: p-values reported are for highest order significant interaction term. These are cubic (health utilities), quadratic (mental component summary), and quadratic (physical component summary), respectively. All models included the following variables as covariates: age, gender, education, and CCI score (comorbidity burden).
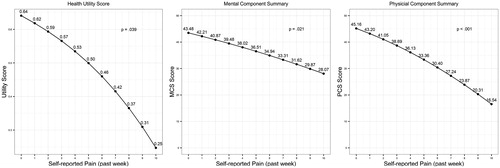
Figure 2. Predicted work productivity impairment by pain severity (past 6 months). Note: p-values reported are for highest significant interaction term. These are linear (absenteeism) and quadratic (presenteeism), respectively. All models included the following variables as covariates: age, gender, education, and CCI score (comorbidity burden).
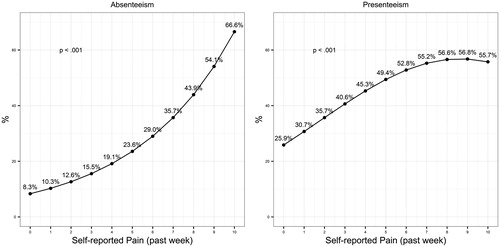
Figure 3. Predicted healthcare resource use by pain severity (past 6 months). Note: p-values reported are for the highest significant interaction term. These are quadratic (ER visits), linear (hospital visits), and linear (primary care provider visits), respectively. All models included the following variables as covariates: age, gender, education, and CCI score (comorbidity burden).
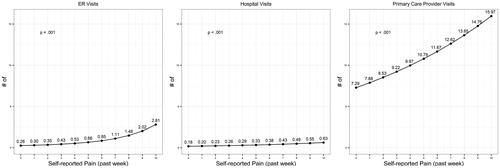
Table 3. General form of equations.
Table 4. Unstandardized regression coefficients (b values) from multiple regression models by outcome.
Table 5. Adjusted/estimated means for all study outcomes by level of pain severity in the past week.