Figures & data
Figure 1. Liver transplantation model structure.
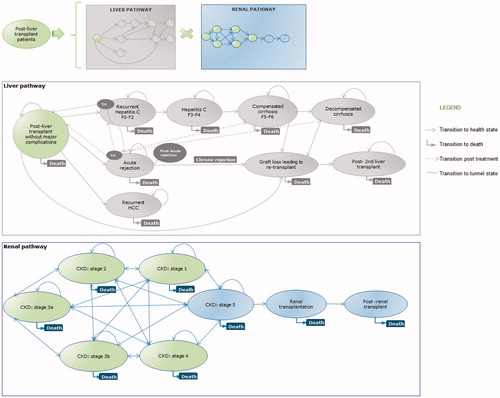
Table 1. Unit cost per milligram.
Table 2. Estimated annual health states costs (EUR; €).
Table 3. Health state utilities post-liver transplantation.
Table 4. Lifetime base case results.
Figure 2. Sub-group analyses results (lifetime horizon).
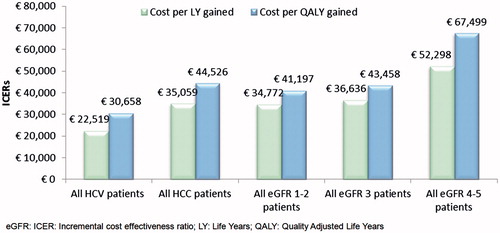
Figure 3. Tornado diagram: cost per QALY gained.
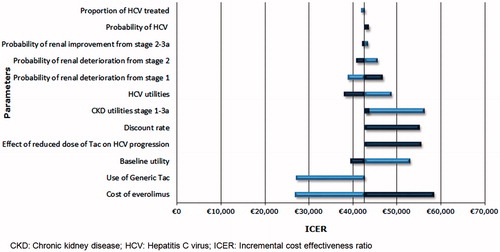
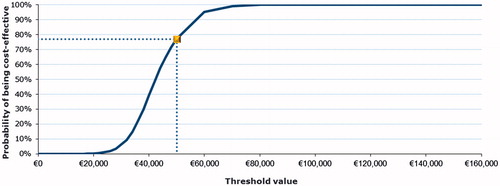
Figure 4. Cost-effectiveness acceptability curve.