Figures & data
Figure 1. Markov model. Arrows indicate transitions. Arrows that curve back to the same state represent remains in the same state. DFS: Disease free survival. CHF: congestive heart failure.
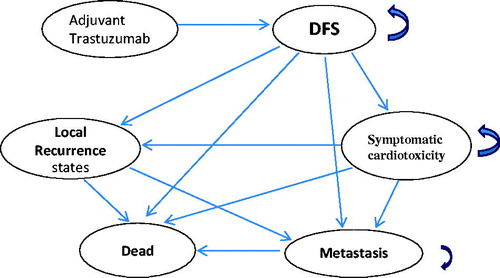
Figure 2. Toranado analysis. EV, expect value of ICER for Trastuzmab
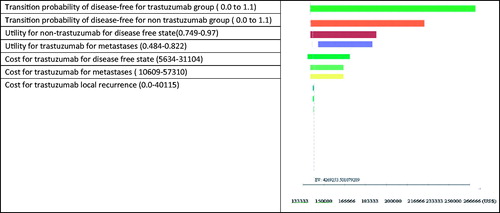
Table 1. Parameters data in sensitivity analysis.
Table 2. Cost-effectiveness analysis for lifetime model.
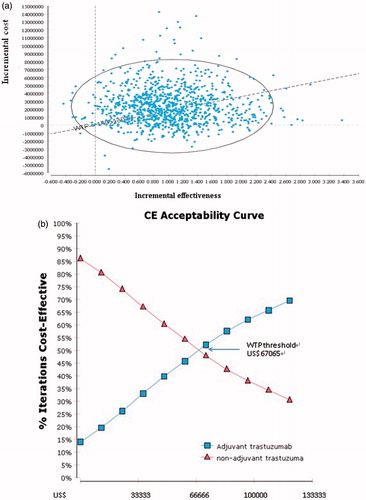
Figure 3. (a) Incremental cost-effectiveness plane. A sample of 10,000 results of the Markov Chain Monte Carlo simulation are plotted. The diagonal line represents a willingness-to-pay threshold of this study, where estimates below this line are cost-effective. (b) Cost-effectiveness acceptability curve. These show that probability that a specific treatment is cost-effective at a given willingness-to-pay threshold of US$67,060 (NT$2,213,145).