Figures & data
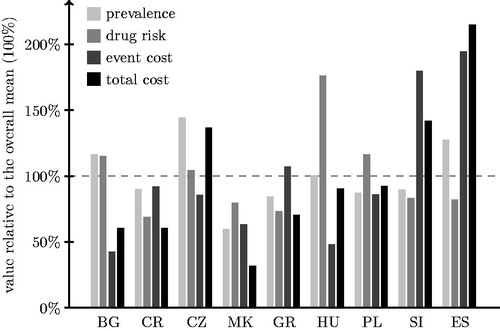
Figure 1. General modeling framework.
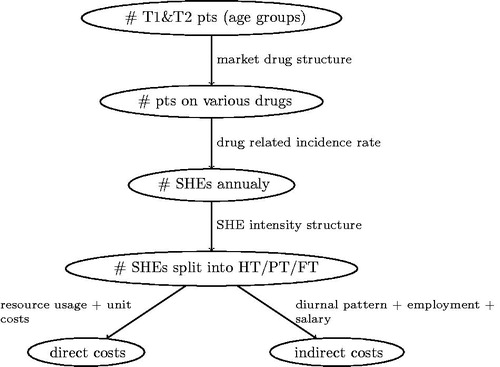
Table 1. Number of diagnosed and treated type 1 and type 2 diabetes mellitus patients.
Table 2. Market share of pre-defined drug regimens (%) and annual SHE rate for every treatment pattern (episode per pt.).
Table 3. Resources usage and quantity of units used per hospital, medical professional, and family treated SHE (% of cases, number of units used per patient).
Table 4. Resource unit prices for public payer (€).
Table 5. Direct and overall societal costs per single SHE (€).
Table 6. Total costs of SHEs treatment in all countries (€).
Figure 2. Between-country comparison of costs and its components (BG = Bulgaria, CR = Croatia, CZ = the Czech Republic, MK = Macedonia/the former Yugoslav Republic of Macedonia, GR = Greece, HU = Hungary, PL = Poland, SI = Slovenia, ES = Spain).