Figures & data
Figure 1. Natural history model schematic. HCV, hepatitis C virus.
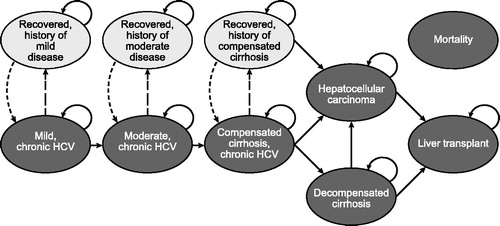
Table 1. Summary of non-treatment-specific variables for those with chronic genotype 1 hepatitis C virus.
Table 2. Sustained virologic response rates for those with chronic genotype 1 hepatitis C virus infection by treatment regimen and fibrosis stage: base-case values.
Table 3. Adverse event rates for those with chronic genotype 1 hepatitis C virus infection by treatment regimen and fibrosis stage: base-case values.
Table 4. Treatment duration for those with chronic genotype 1 hepatitis C virus infection.
Table 5. Treatment-related costs for those with chronic genotype 1 hepatitis C virus infection.
Figure 2. Base-case clinical outcomes for chronic genotype 1 hepatitis C virus infected, (a) treatment-naive patients and (b) treatment-experienced patients. BOC, boceprevir; CC, compensated cirrhosis; DCC, decompensated cirrhosis; DSV, dasabuvir; HCC, hepatocellular carcinoma; IFN, interferon; OMB, ombitasvir; PegIFN, pegylated interferon; PTV, paritaprevir; r, ritonavir; RBV, ribavirin; SOF, sofosbuvir; TPV, telaprevir.
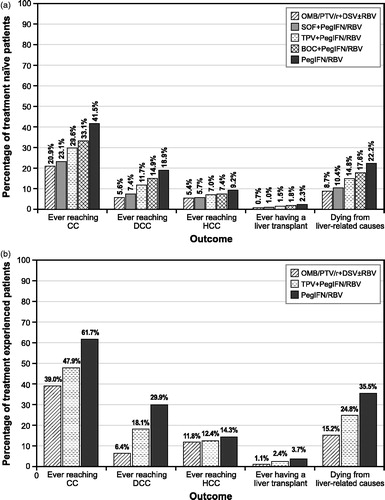
Table 6. Base-case economic results for chronic genotype 1 hepatitis C virus infected, treatment-naïve, and treatment-experienced patients.
Figure 3. Tornado diagram: deterministic sensitivity analysis for (a) treatment-naive and (b) treatment-experienced patients with chronic genotype 1 hepatitis C infection: OMB/PTV/r + DSV ± RBV compared with pegIFN/RBV. CC, compensated cirrhosis; DCC, decompensated cirrhosis; HCC, hepatocellular carcinoma; HCV, hepatitis C virus; OMB/PTV/r + DSV ± RBV, ombitasvir/paritaprevir/ritonavir and dasabuvir ± ribavirin; PegIFN/RBV, pegylated interferon + ribavirin; SVR, sustained virologic response.
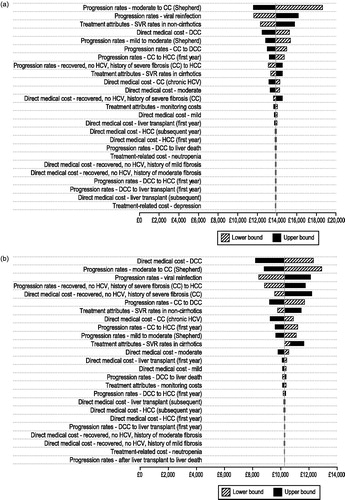
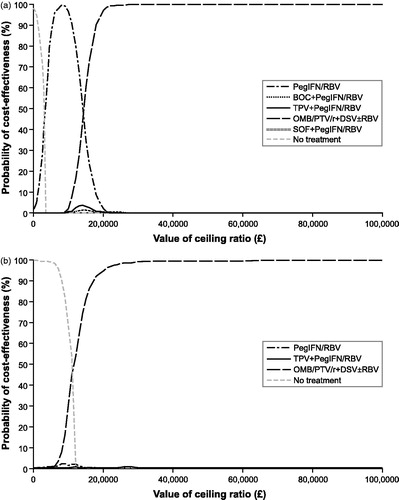
Figure 4. Cost-effectiveness acceptability curves for (a) treatment-naive and (b) treatment-experienced patients with chronic genotype 1 hepatitis C infection. BOC, boceprevir; OMB/PTV/r + DSV ± RBV, ombitasvir/paritaprevir/ritonavir and dasabuvir ± ribavirin; PegIFN/RBV, pegylated interferon + ribavirin; SOF, sofosbuvir; TPV, telaprevir.