
Figures & data
Table 1. Medical inventory of TSC primary organ system codes (MedITOSC).
Figure 1. Patient exclusion criteria to arrive at the TSC study population and the Renal TSC study population.
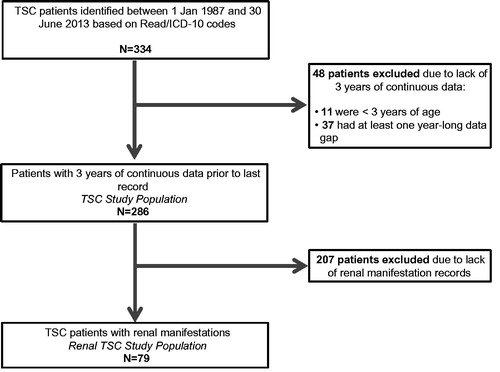
Figure 2. Age and sex distribution of renal TSC and comparator cohort patients. * Age is defined at the beginning of the 3-year period.
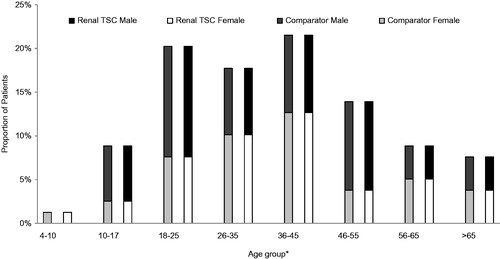
Table 2. Renal involvement in TSC.
Figure 3. Proportions of renal TSC patients with specific renal conditions.
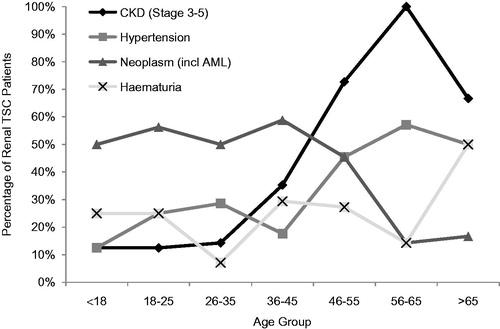
Table 3. Distribution of manifestations in renal TSC patients.
Table 4. Renal-related procedures conducted in TSC and comparator patients during their entire history.
Table 5. Renal-related tests and investigations conducted in TSC and comparator patients during their entire history.
Table 6. Primary and secondary healthcare encounters in TSC and comparator cohort during the most recent 3-year period.
Figure 4. Mean costs per renal TSC patient over the 3-year period by type of healthcare resource used. *Only includes the cost of GP visits (costs of tests conducted at the GP practice are not included). †Costs including GP administration encounters: £3,967 TSC vs £1,505 comparator. ‡Total including GP administration encounters: £15,695 TSC vs £4,765 comparator.
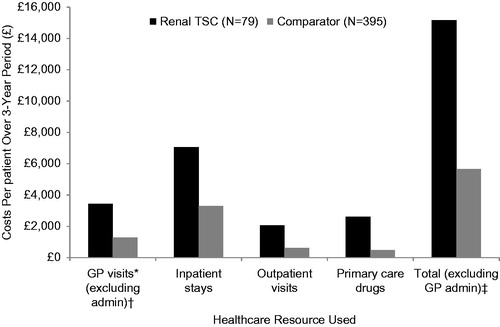
Figure 5. Cost of additional manifestation categories to renal TSC patients.
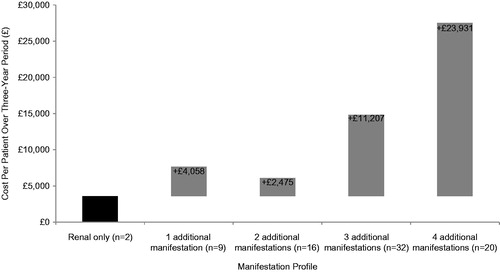
Table 7. Model 1: Key drivers of direct costs in renal TSC patients during the most recent 3-year period.
Table 8. Model 2: Key drivers of direct costs in renal TSC during the most recent 3-year period.
Table 9. Model 2: Drivers of direct costs in renal TSC by specific number of primary manifestation categories during the most recent 3-year period.