
Figures & data
Table 1. Data inputs: Baseline characteristics and treatment effects (mean, SETable Footnote*).
Table 2. Data inputs: Annual cost of medications and complications (€EUR) and health state utility changes.
Figure 1. Modeling weight progression.
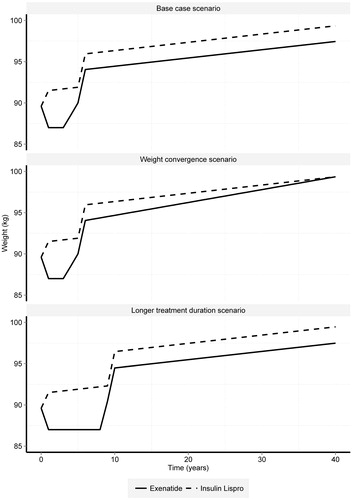
Table 3. Expected costs, QALYs, and incremental cost-effectiveness (1000 people over 40 years): base case and deterministic sensitivity analysis (1000 people over 40 years).
Supplemental material