Figures & data
Table 1. Demographic and clinical characteristics of patients enrolled in clinical studies informing the cost-effectiveness model.
Figure 1. Kaplan-Meier estimates of PFS and OS, by comparator. (a) Brentuximab vedotin: PFS (investigator-assessed) and OS were taken from SG035-0003Citation12, measured from trial entry. (b) C/R: PFS was taken from SG035-0003 for the most recent prior post-ASCT therapy (n = 56), measured from trial entryCitation12; OS was taken from Martinez et al., 2013Citation9 for C/R, measured from ASCT failure and adjusted for case mix. (c) AlloSCT: PFS was taken from Robinson et al., 2009Citation27 for RIC alloSCT, measured from ASCT failure; OS was taken from Martinez et al., 2013Citation9 for RIC and myeloblative alloSCT, measured from ASCT failure and adjusted for case mix. alloSCT, allogenic stem cell transplant; ASCT, autologous stem cell transplant; C/R, chemotherapy ± radiotherapy; PFS, progression-free survival; OS, overall survival; RIC, reduced-intensity conditioning.
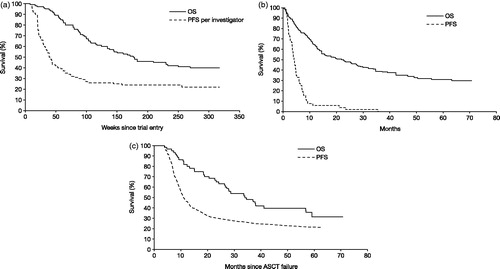
Figure 2. Long-term extrapolations of PFS and OS, by comparator. (a) PFS: 0–6.08 years, brentuximab vedotin SG035-0003 dataCitation12 were compared with self-control and Robinson et al., 2009Citation27 data; 6.08 years–lifetime, all comparators were assumed to have the same constant risk of progression. (b) OS: 0–5.67 years, brentuximab vedotin SG035-0003 dataCitation12 were compared directly with Martinez et al., 2013Citation9 data; 5.67–6.0 years, brentuximab vedotin dataCitation12 were extrapolated with a hazard ratio of 1.0 applied to the Martinez et al., 2013Citation9 hazard; 6.0–lifetime, all comparators were assumed to have the same constant risk of death. alloSCT, allogenic stem cell transplant; C/R, chemotherapy ± radiotherapy; OS, overall survival; PFS, progression-free survival.
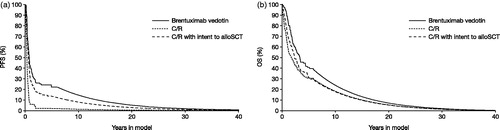
Table 2. Discounted life years (LYs), QALYs and costs by resource category.
Table 3. Base case cost-effectiveness.
Table 4. Deterministic sensitivity analyses.
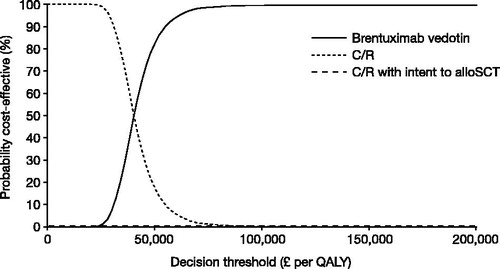
Figure 3. Cost-effectiveness acceptability curve (alloSCT eligible patients). AlloSCT, allogenic stem cell transplant; C/R, chemotherapy ± radiotherapy; QALY, quality-adjusted life year.