
Figures & data
Table 1. Baseline demographics and clinical characteristics in patients from all UNCOVER studies and from UNCOVER-3 only—intent-to-treat patients with baseline DLQI >10.
Table 2. EQ-5D-5L and EQ-PSO responses at baseline and Week 12 by PASI improvement level—intent-to-treat patients with baseline DLQI >10.
Figure 1. No problems on the EQ-5D-5L Dimensions—Overall Population From UNCOVER-1, UNCOVER-2, and UNCOVER-3. Change in the percentage of patients reporting no problems on each of the five dimensions of the EQ-5D-5L questionnaire over time by PASI improvement level. Percentage of patients reporting no problems at baseline are shown in grey and the percentage of patients reporting no problems at Week 12 are shown in black. Includes patients from UNCOVER -1, UNCOVER-2, and UNCOVER-3 with baseline DLQI >10 and non-missing EQ-5D-5L values (n = 2085). DLQI, Dermatology Life Quality Index; EQ-5D-5L, EuroQoL 5-Dimension Health Questionnaire–5 levels; PASI, psoriasis area and severity index.
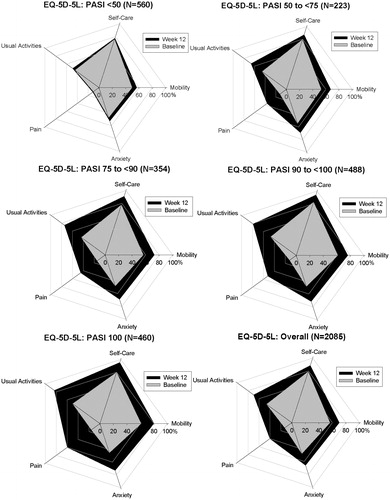
Figure 2. No problems on the EQ-PSO Dimensions—Population From UNCOVER-3 Only. Change in the percentage of patients reporting no problems on each of the five dimensions of the EQ-PSO questionnaire over time by PASI improvement level. Percentage of patients reporting no problems at baseline are shown in grey and the percentage of patients reporting no problems at Week 12 are shown in black. Includes patients from UNCOVER-3 only with baseline DLQI >10 and non-missing EQ-PSO values (n = 645). DLQI, Dermatology Life Quality Index; EQ-PSO, EuroQoL 5-Dimension Health Questionnaire—psoriasis-specific dimensions; PASI, psoriasis area and severity index.
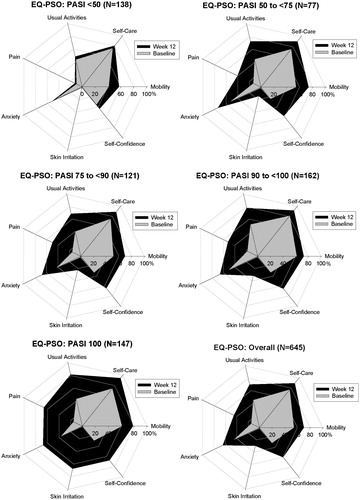
Table 3. EQ-5D VAS descriptive analysis at baseline and week 12 by PASI improvement level in patients from all UNCOVER studies—intent-to-treat patients with baseline DLQI >10.
Table 4. LS mean health utility improvement from baseline by PASI improvement level.