Figures & data
Table 1. Patient disposition and demographic characteristics.Table Footnotea
Table 2. Unit costs of resource use in individual EU countries.
Figure 1. Association of reliever use ± breathlessness on (a) sleep and COPD-related health status and (b) general health status at the time of survey*. *Values based on weighted data; RU, Reliever use; CAT, COPD assessment test; EQ-5D (3L), EuroQoL questionnaire (3 levels); p < .0001 for all unadjusted comparisons between RU-Less than once a week and RU-Once a week or more within each cohort.
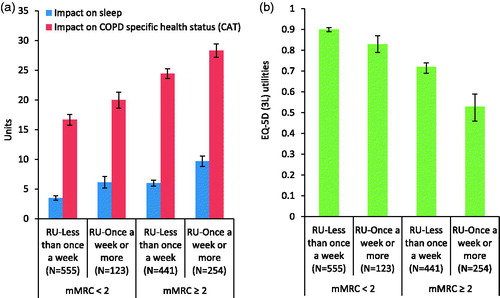
Figure 2. Resource use in prior 12 months by frequency of reliever inhaler use and dyspnea. Rates based on weighted data; p < 0.0001 for all unadjusted comparisons between RU-Less than once a week and RU-Once a week or more within each dyspnea cohort; p < .01 for all unadjusted comparisons between mMRC <2 and mMRC ≥2 within each reliever use strata.
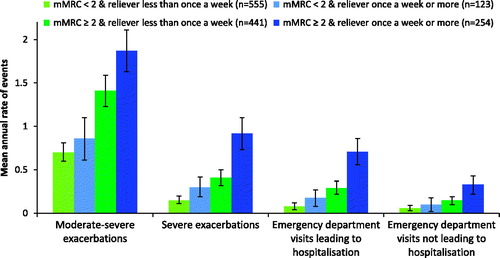
Figure 3. Costs in prior 12 months by frequency of reliever inhaler use and dyspnea, based on weighted data.
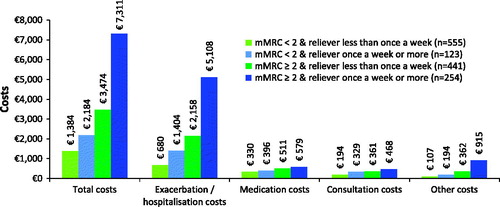
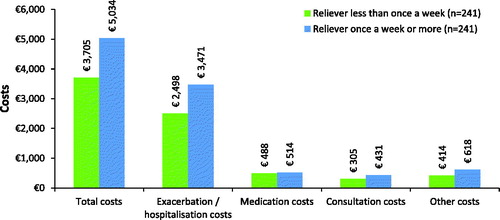
Figure 4. Costs by frequency of reliever inhaler use in the propensity matched patient cohort.