Figures & data
Figure 1. Flowchart of inclusion/exclusion criteria applied to ISPOR comparative table of pharmacoeconomic guidelines.
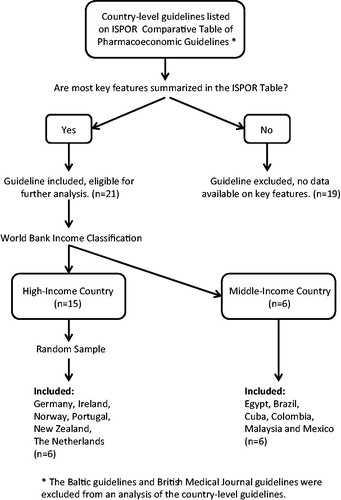
Table 1. Key features of the pharmacoeconomic guidelines in South Africa.
Table 2. Private health expenditure by country as a percentage of GDP and at market prices.
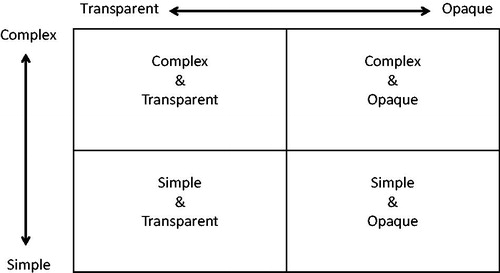
Figure 2. Complexity and transparency in pharmacoeconomic submissions.