
Figures & data
Table 1. Demographic and clinical characteristics of the patients.
Figure 1. Percentage of direct-cost components for patients with AF (Group A) or without AF (Group S). AF, atrial fibrillation; ECG, electrocardiogram; CT, computed tomography; MRI, magnetic resonance imaging.
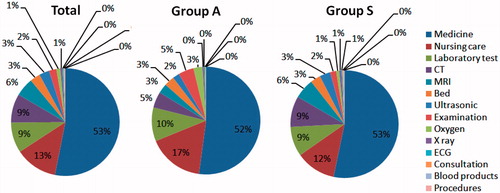
Table 2. Hospitalization expenses of patients.Table Footnote*
Table 3. Univariate analysis of hospital costs and hospital stay, correlation coefficients, r (p).
Table 4. Multivariate analysis of hospital costs and length of stay.