Figures & data
Figure 1. Model schematic. Patients enter the model in fibrosis stages F0–F4 and, in the absence of treatment, progress to liver complications and liver-related death according to the annual transition rates derived from the literature (shown next to each arrow). Death owing to all-cause (non-liver-related) mortality can occur during each cycle for patients in F0–F4. SVR12 rates for patients treated with antivirals during stages F0–F4 were derived from clinical trials or published literature. In cases where SVR12 rates were not reported independently for each fibrosis stage, weighted averages of the reported SVR12 rates were calculated, using the fibrosis distribution shown in the model as weighting factors. *Annual transition probability subsequent to Year 1. Sources: aINVS 2004, 2007Citation16,Citation21, bPogorzelska and Flisiak 2016Citation22, cWalker et al. 2015Citation23, dLawitz et al. 2013Citation24, ePoordad et al. 2011Citation25, fThein et al. 2008Citation26, gLiu et al. 2012Citation27, hAlazawi et al. 2010Citation28, iRazavi et al. 2013Citation29, jSingal et al. 2010Citation30, kThuluvath et al. 2010Citation31. CC, compensated cirrhosis (Metavir fibrosis score F4); CHC, chronic hepatitis C; D, all-cause death; DAA, direct-acting antiviral; DCC, decompensated cirrhosis; F, Metavir fibrosis score; HCC, hepatocellular carcinoma; LrD, liver-related death (i.e. death from DCC, HCC, and LT); LT, liver transplant; PI, protease inhibitor; RBV, ribavirin; SOC, standard of care; SVR12, sustained virologic response 12 weeks after treatment.
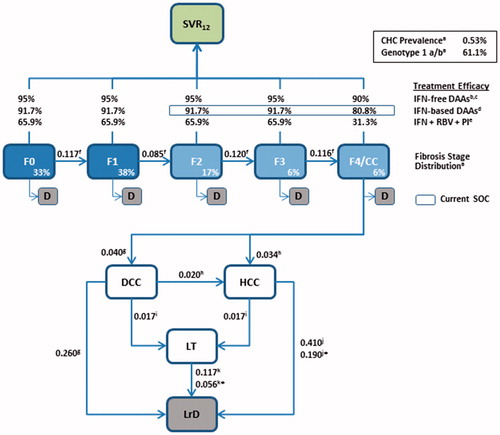
Table 1. Direct medical costs associated with HCV screening and treatment (€).
Figure 2. Cumulative number of newly-diagnosed HCV cases by fibrosis stage and screening variant. CC, compensated cirrhosis; F, Metavir fibrosis score; HCV, hepatitis C virus.
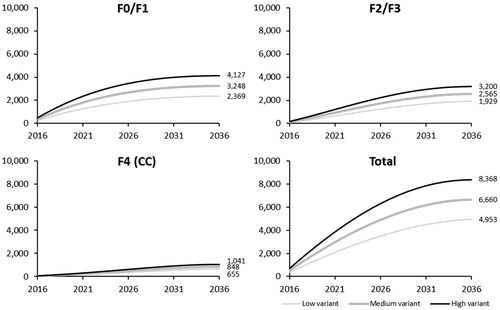
Table 2. Public health impact of HCV treatment strategy: Number of LYs across health states, HCV-related costs, return-on-investment, QALYs, and cost-effectiveness analyses (intermediate screening variant).
Figure 3. One-way sensitivity analysis on the cost per QALY per treatment strategy. CC, compensated cirrhosis; DAA, direct-acting antiviral; DCC, decompensated cirrhosis; F, Metavir fibrosis score; HCC, hepatocellular carcinoma; HCV, hepatitis C virus; IFN, interferon; LY, life-year; PI; protease inhibitor; RBV, ribavirin; SVR12, sustained virologic response 12 weeks after treatment; TP, transition probability.
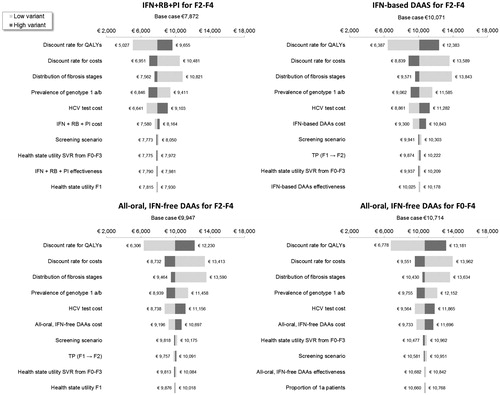
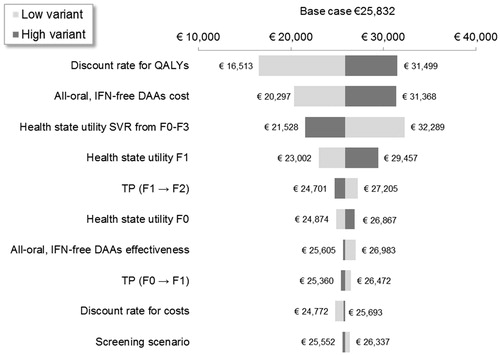
Figure 4. One-way sensitivity analysis on the incremental cost per QALY of all-oral, IFN-free DAAs for F0–F4 vs all-oral, IFN-free DAAs for F2–F4. DAA, direct-acting antiviral; F, Metavir fibrosis score; IFN, interferon; LY, life-year; SVR12, sustained virologic response 12 weeks after treatment; TP, transition probability.