
Figures & data
Figure 1. Model schematic.
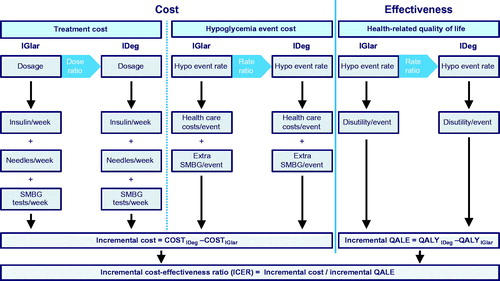
Table 1. Health-related quality-of-life disutilities associated with severe hypoglycemia in the base case analysis and with non-severe hypoglycemia in sensitivity analysis.
Table 2. Rates of hypoglycemia in the base case analysis. Base rates were from a Danish study of self-reported hypoglycemia, while rate ratios were derived from a meta-analysis of randomized trials in the BEGIN trial program.
Table 3. Unit costs for healthcare resource use for patients required medical assistance for severe hypoglycemia (27.8% of patients).
Table 4. Base insulin dosing and dose ratios in the reference case analysis.
Table 5. Unit costs used in the analysis.
Table 6. Base case cost-effectiveness outcomes in type 1 and 2 diabetes with basal-bolus insulin, and type 2 diabetes with a basal-only regimen.
Figure 2. Cost-effectiveness scatterplots for insulin degludec vs insulin glargine in patients with type 1 diabetes on basal-bolus and in patients with type 2 diabetes on basal-only or basal-bolus therapy.
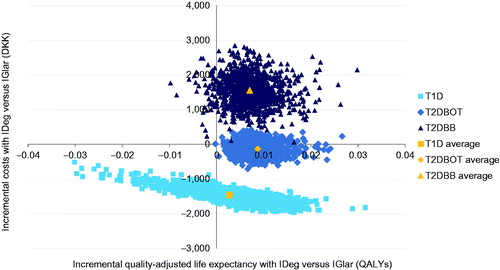
Figure 3. Cost-effectiveness acceptability curves for each analysis over a range of willingness-to-pay values spanning DKK 0–400,000 per QALY gained.
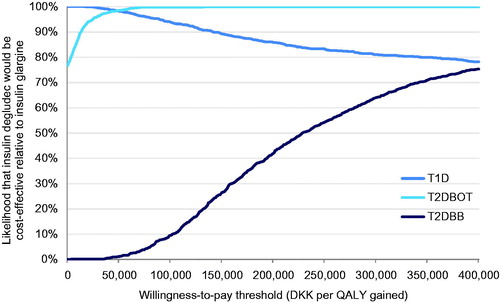
Table 7. One-way sensitivity analysis outcomes.