Figures & data
Table 1. Initial epithelialization and mortality probabilities.
Figure 1. Epithelialization rates of stage IV pressure ulcers for clostridial collagenase ointment (CCO) added to selective debridement and selective debridement alone (non-CCO) in 4-week cycles.
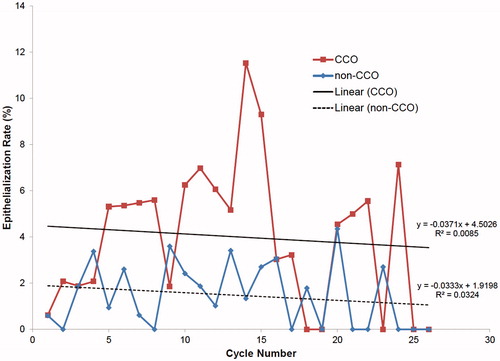
Table 2. Classification of pressure ulcer location to cost unit categories.
Table 3. Unit costs (US dollars).
Table 4. Four-week cycle costsTable Footnotea (US dollars) for each intervention.
Table 5. Unit costs (US dollars) associated with surgical wound closure.
Table 6. Variables used in sensitivity analysis.
Figure 2. Population metrics for individuals in different health states in clostridial collagenase ointment (CCO) added to selective debridement and selective debridement alone (non-CCO) over the 2-year period.
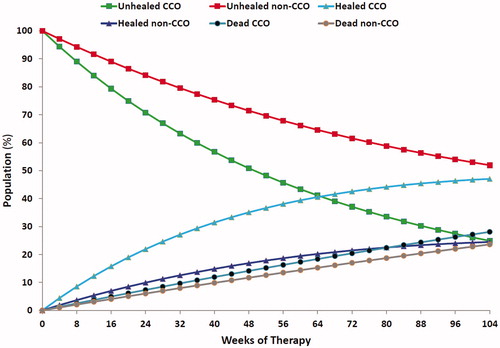
Figure 3. Epithelialized wound weeks with clostridial collagenase ointment (CCO) added to selective debridement and selective debridement alone (non-CCO) over the 2-year period.
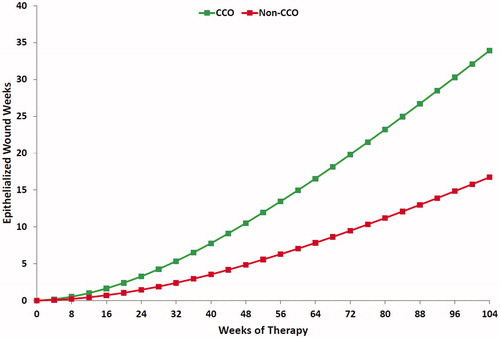
Figure 4. Cumulative costs with clostridial collagenase ointment (CCO) added to selective debridement and selective debridement alone (non-CCO) over the 2-year period.
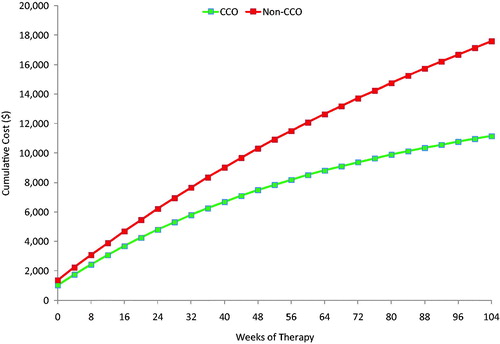
Figure 5. Influence of parameter uncertainty on the expected cost of clostridial collagenase ointment (CCO) added to selective debridement relative to selective debridement alone (non-CCO).
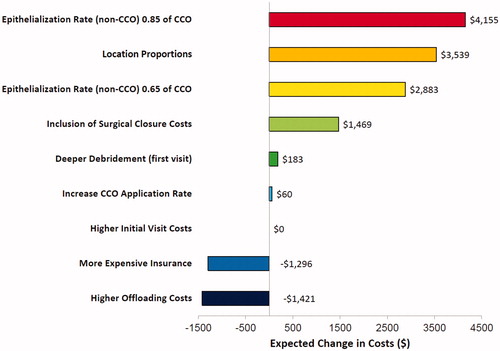
Figure 6. Influence of parameter uncertainty on the expected benefits of clostridial collagenase ointment (CCO) added to selective debridement relative to selective debridement alone (non-CCO).
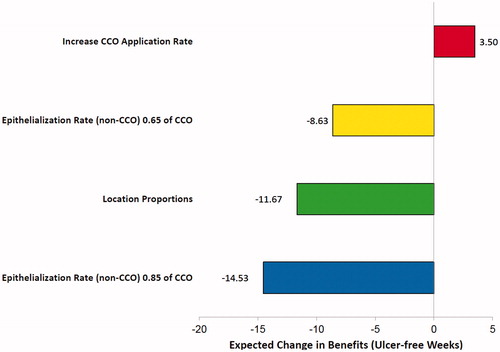
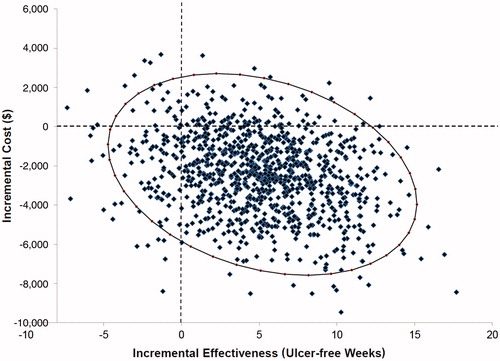
Figure 7. Probabilistic sensitivity analysis. Each point on the plot corresponds to one trial in the Monte Carlo simulation comparing the incremental effectiveness and costs of therapy. The ellipse encompasses 95% confidence intervals.