
Figures & data
Figure 1. Descriptive flow of calculations performed by the LIHT. HCP: healthcare professional; LIHT: Local Impact of Hypoglycemia Tool; T1DM: type 1 diabetes mellitus; T2DM: type 2 diabetes mellitus.
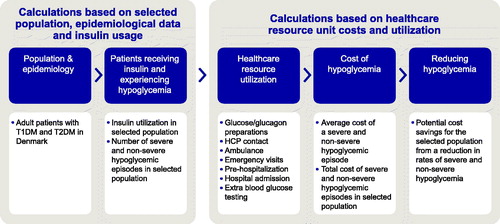
Figure 2. Treatment pathway and healthcare utilization values. GP: general practitioner; SMBG: self-monitored blood glucose; T1DM: type 1 diabetes mellitus; T2DM: type 2 diabetes mellitus.
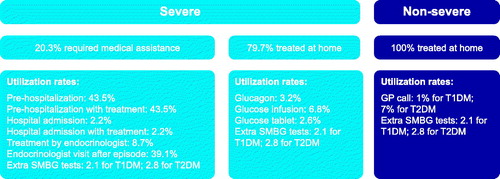
Table 1. Unit costs for healthcare resources.
Table 2. Cost breakdown per episode for severe and non-severe hypoglycemia.
Table 3. Direct costs of insulin-related hypoglycemia per year in Denmark and in a sample population of 100,000.
Table 4. Costs associated with rates of hypoglycemia in Denmark.
Figure 3. A tornado diagram showing the top 10 drivers of the model. GP: general practitioner; SMBG: self-monitoring blood glucose.
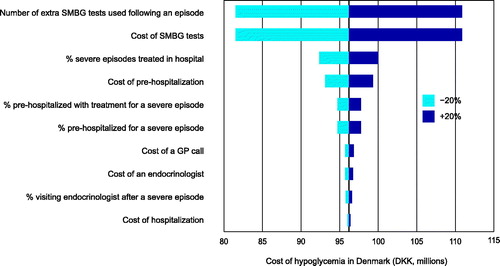
Table 5. Comparison of the results for Denmark with the results from the UK.