
Figures & data
Figure 1. Schematic structure of the decision model.
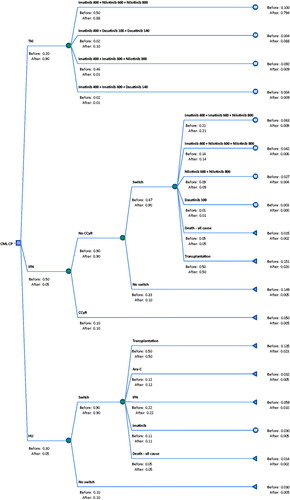
Figure 2. Schematic presentation of the Markov model structure for TKI treatment. Note, patients in CP/AP are not assumed to die from CML (unless post-transplant), but may die of non-CML mortality (not shown for readability).
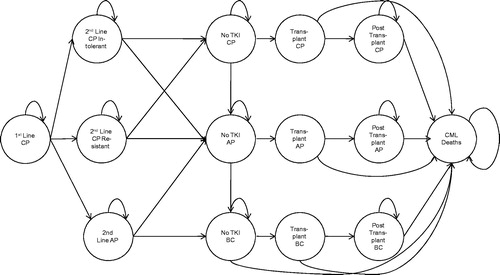
Table 1. TKI treatment disposition at 12 months: treatment continuations/discontinuations.
Table 2. TKI treatment disposition at 12 months: response levels.
Table 3. Monthly transition probabilities from second line TKI to next states.
Table 4. TKI drug costs with PAP.
Table 5. Cost and clinical effectiveness of IFN, HU, and transplant therapy.
Table 6. Discount rates.
Table 7. Incremental cost-effectiveness ratios (ICER) for patients with insurance coverage.
Figure 3. One-way sensitivity analyses tornado diagram.
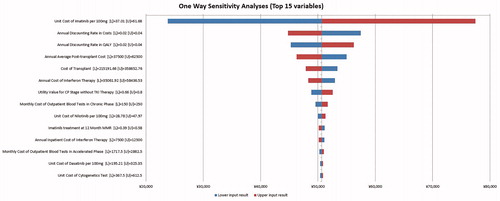
Figure 4. Cost-effectiveness scatter plot.
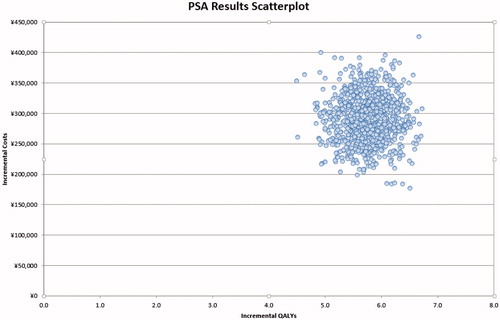
Figure 5. Cost-acceptability curve: insurance coverage with imatinib vs no insurance coverage.
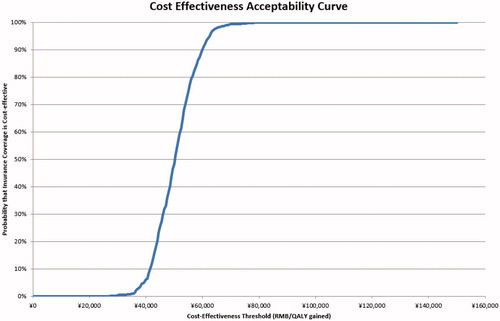
Table 8. Incremental cost-effectiveness ratios (ICER) for patient with insurance coverage at 3 and 5 years after diagnosis.