Figures & data
Figure 1. Patient flow for GI and lung NET treatment. Patient counts are based on a hypothetical health plan with 1 million members.
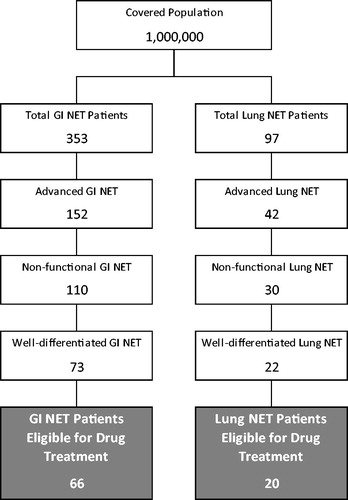
Table 1. Treatment-eligible patient population estimates.
Table 2. GI and lung NET budget impact model: total costs.
Figure 2. GI NET budget impact model: budget impact with and without the introduction of everolimus.
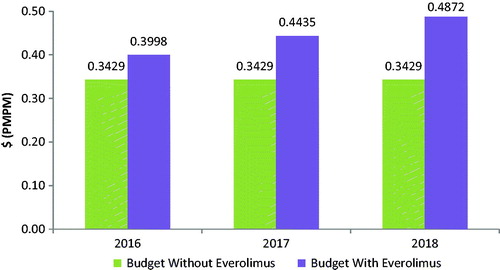
Figure 3. Lung NET budget impact model: budget impact with and without the introduction of everolimus.
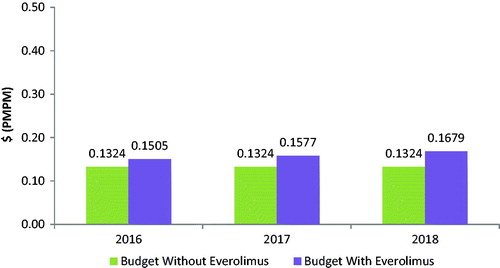
Table 3. GI and lung NET budget impact model: summary of results.
Figure 4. GI NET pharmacy model: budget impact with and without the introduction of everolimus.
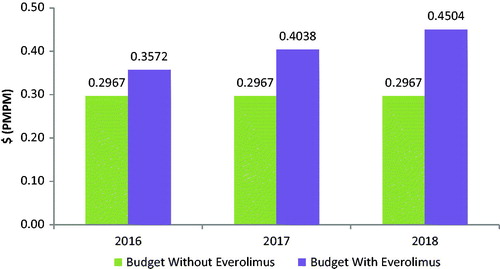
Figure 5. Lung NET pharmacy model: budget impact with and without the introduction of everolimus.
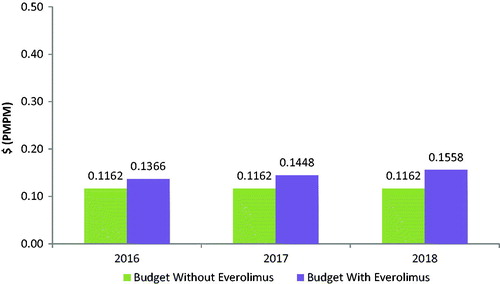
Table 4. GI and lung NET pharmacy model: results.
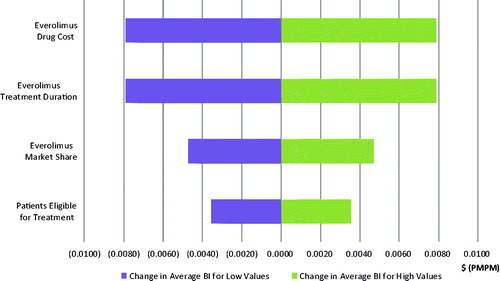
Figure 6. GI NET budget impact model: sensitivity analysis.
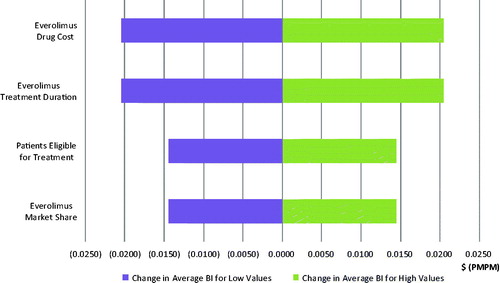
Figure 7. Lung NET budget impact model: sensitivity analysis.