Figures & data
Figure 1. Diagrammatic representation of the IMS CORE Diabetes Model of Palmer et al.Citation18
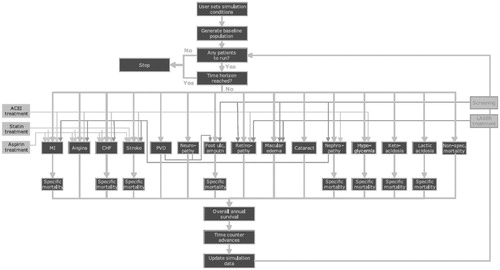
Table 1. Baseline cohort characteristics BMI ≥30 kg/m2 (AWARD-6).
Table 2. Modeled rates of diabetes complications at baseline.
Table 3. Treatment effects for BMI ≥30 kg/m2 (AWARD-6).
Table 4. Health state and treatment related utilities.
Table 5. Drug prices (€2014) in Spain.
Table 6. Needle and SMBG prices (€2014) in Spain.
Table 7. Annual treatment costs (€) in Spain.
Table 8. Management costs (€annual).
Table 9. Parameters and distributions used in PSA.
Table 10. Base case outputs (dulaglutide 1.5 mg – liraglutide 1.8 mg).
Table 11. Sensitivity analyses (dulaglutide 1.5 mg – liraglutide 1.8 mg).
Figure 2. Cost-effectiveness pairs for dulaglutide 1.5 mg vs liraglutide 1.8 mg.
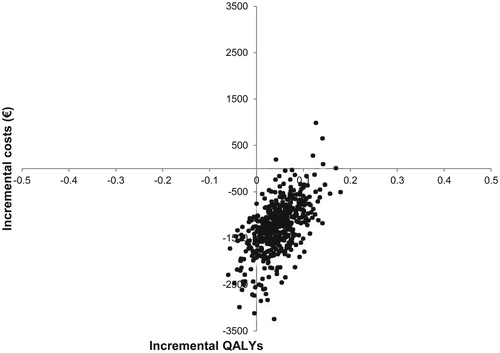
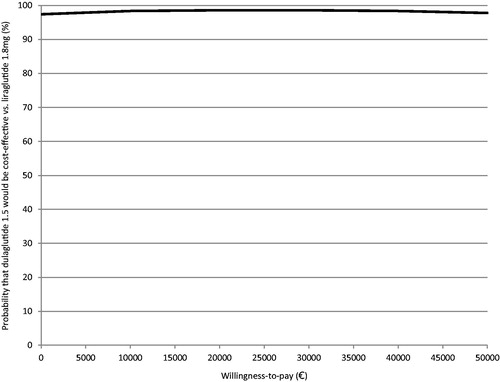
Figure 3. Cost-effectiveness acceptability curve for dulaglutide 1.5 mg vs liraglutide 1.8 mg.