Figures & data
Figure 1. Design of study to estimate CV burden in high-risk patients. ACS: acute coronary syndrome; CPRD: Clinical Practice Research Datalink; CV: cardiovascular; HF: heart failure; IS: ischemic stroke; MI: myocardial infarction; UA: unstable angina.
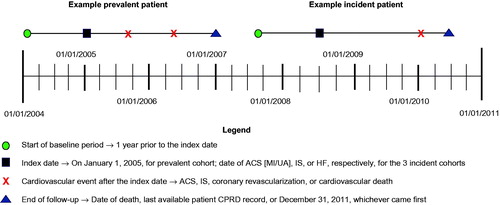
Table 1. FOURIER eligibility criteria applied to study cohorts.
Figure 2. Cost-effectiveness model structure for value-based pricing analysis.
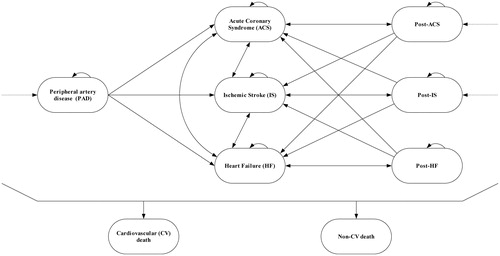
Table 2. Cost-effectiveness model inputs: rate ratio of CV events per 1 mmol/L of LDL-C reduction, utility values, and direct costs.
Table 3. Demographic and clinical characteristics of CPRD cohorts at baseline.
Table 4. Cumulative incidence of CV events among the different cohorts in the observational study.
Table 5. CV event incidence rates per 100 patient-years.
Table 6. Cost-effectiveness results for EvoMab added to SOC vs SOC alone.
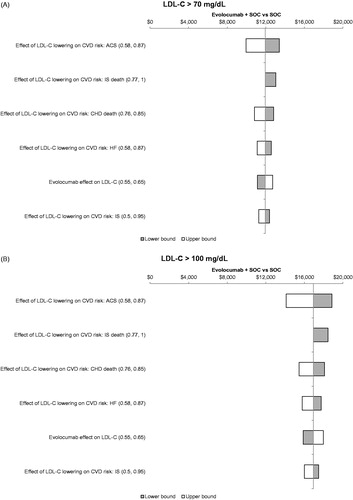
Figure 3. Tornado diagram for estimated value-based price range at a WTPT of $150,000 per QALY gained by baseline LDL-C (a) ≥ 70 mg/dL and (b) ≥100 mg/dL. Only factors that affected the ICER by ≥5% are displayed. ACS: acute coronary syndrome; CHD: coronary heart disease; CVD: cardiovascular disease; HF: heart failure; ICER: incremental cost-effectiveness ratio; IS: ischemic stroke; LDL-C: low-density lipoprotein-cholesterol; QALY: quality-adjusted life-year; SOC: standard of care; WTPT: willingness-to-pay threshold.