Figures & data
Table 1. Clinical inputs.
Table 2. Cost inputs—surgery-related costs.
Figure 1. Estimated net cost impact of using FLOSEAL vs SURGIFLO in an average US hospital performing 245 cardiac surgical procedures per year.
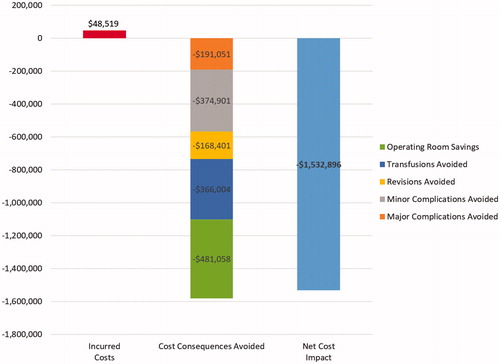
Figure 2. One-way sensitivity analysis results.
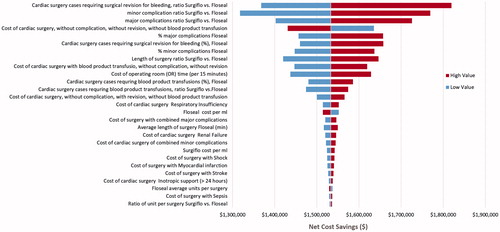
Figure 3. PSA for net cost savings.
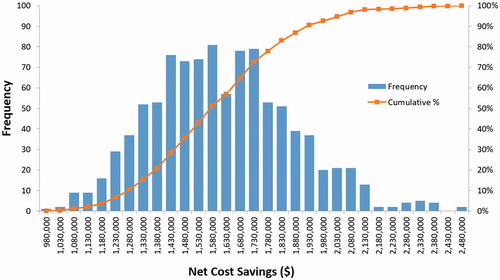
Table A1. Probability distributions for clinical inputs.
Table A2. Probability distributions for cost inputs.
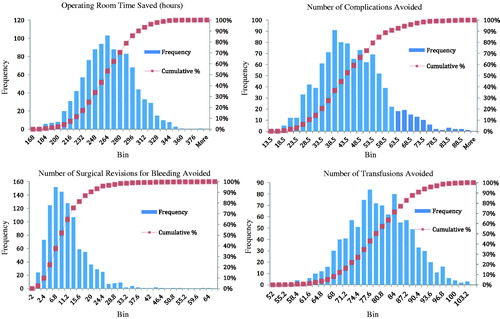
Figure A1. PSA—clinical outcomes.