
Figures & data
Table 1. Baseline demographic characteristics by chronic kidney disease stage.
Table 2. Adjusted annual utilization estimates by chronic kidney disease stage.
Table 3. Adjusted annual expenditure estimates by chronic kidney disease stage.
Figure 1. Adjusted 12-month follow-up all-cause and diabetes-specific medical expenditures by CKD stage.
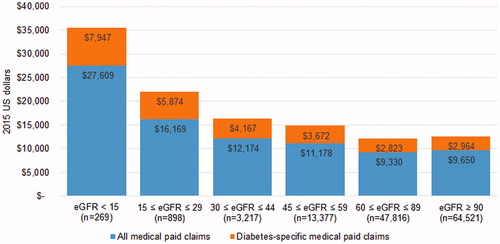
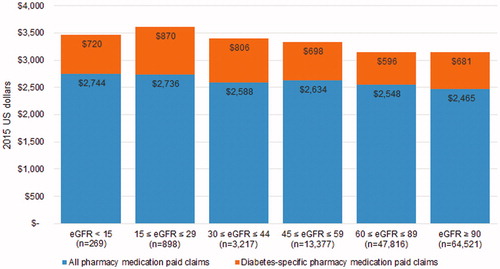
Figure 2. Adjusted 12-month follow-up all-cause and diabetes-specific pharmacy expenditures by CKD stage.
Supplemental material