
Figures & data
Figure 1. Flow diagram of the MONARCH model.
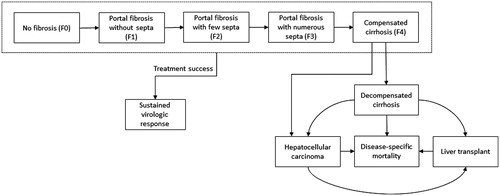
Table 1. Model inputs.
Table 2. Base-case discounted results.
Table 3. DSA discounted results.
Figure 2. PSA scatterplot results—discounted costs vs QALYs.PSA: probabilistic sensitivity analysis; QALY: quality-adjusted life years.Note: Costs and QALYs have been discounted using a 3% annual rate.
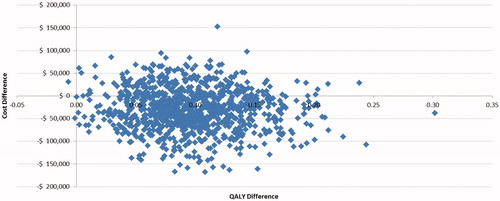
Figure 3. Cost-effectiveness acceptability curve.
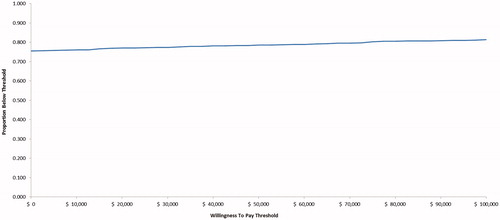
Table 4. Scenario analysis discounted results.
Table 5. Summary of published economic studies in GT 3 HCV.