Figures & data
Table 1. Costs, infection rate, and mortality considered in the model.
Figure 1. Short-term decision model.
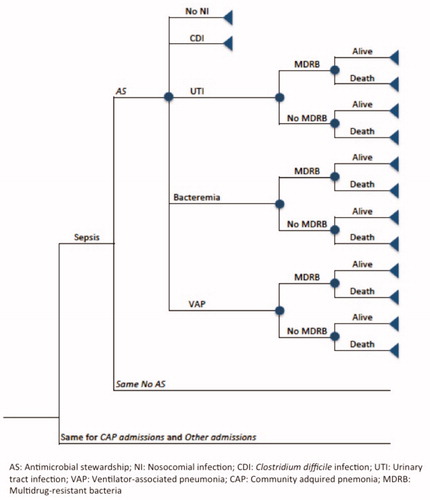
Table 2. Probability values and fixed applied during probabilistic sensitivity analysis.
Figure 2. Results of short-term univariate analysis. Each horizontal line represents how the variation of the variables affects the final result obtained in the model (–€71,738). The variations considered were 20% for the reason of admission in the critical care unit (Sepsis and NAC) and in the incidence of nosocomial infection, 50% for the reduction in the incidence of CDI, 30% for the reduction of the average cost of antimicrobial treatment, and 10% for the number of patients admitted in the critical care unit.
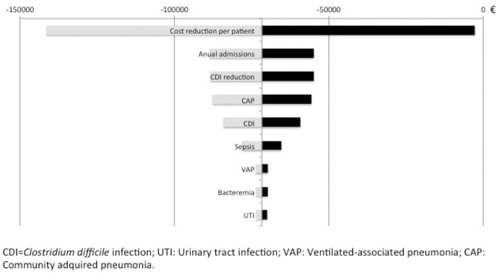
Figure 3. Long-term multivariate analysis results (Cost per LYG).
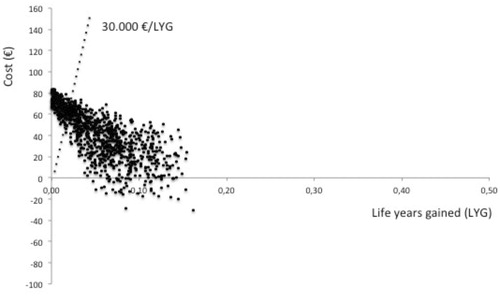
Figure 4. Long-term multivariate analysis results (Cost per resistance avoided).
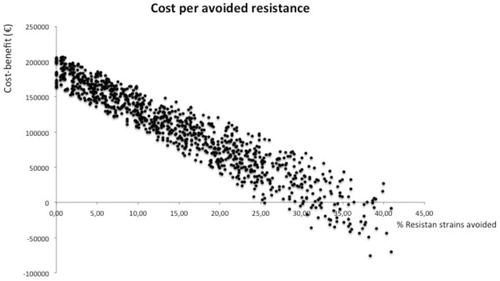
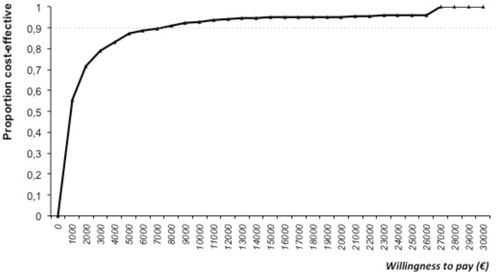
Figure 5. Predicted proportion of cost-effective antimicrobial stewardship (AS) services at incremental willingness to pay per LYG. Incremental cost-effectiveness of implementing an AS was calculated and compared with standard to compute an ICER.