
Figures & data
Table 1. CRN across socioeconomic stratum by gender.
Figure 1. Cost-related medication non-adherence by gender and age. Age groups: 1, 18–24; 2, 25–34; 3, 35–44; 4, 45–54; 5, 55–64; 6, 65+. Error bars represent 95% CIs. CRN rates (the proportion of those who report CRN) were indicated vertically.
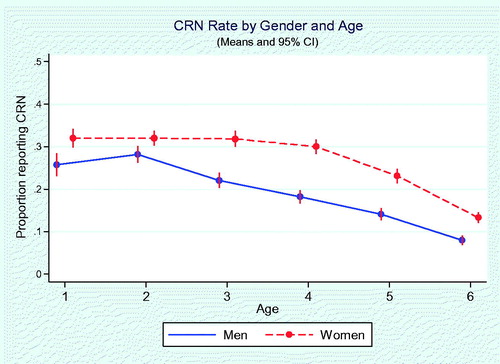
Figure 2. Cost-related medication non-adherence by gender and household income. Household income: 1, Less than $15,000; 2, At least $15,000, but less than $25,000; 3, At least $25,000, but less than $35,000; 4, At least $35,000, but less than $50,000; 5, At least $50,000, but less than $75,000; 6, At least $75,000, but less than $100,000; 7, At least $100,000, but less than $150,000; 8, $150,000 or more. Error bars represent 95% CIs. CRN rates (the proportion of those who report CRN) were indicated vertically.
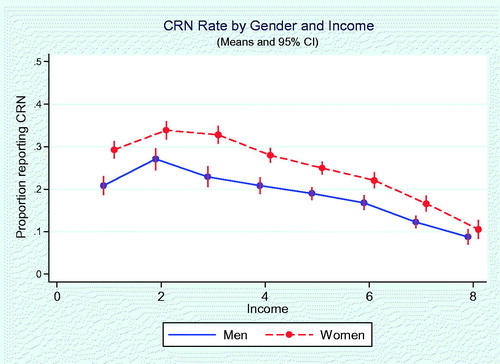
Figure 3. Cost-related medication non-adherence by gender and number of financially dependent children. Number of children was defined as the number of financially dependent children, with 0 as no child or no financially dependent child. Error bars represent 95% CIs. CRN rates (the proportion of those who report CRN) were indicated vertically.
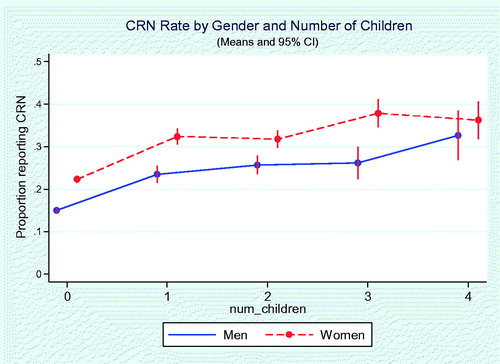
Table 2. Associations between socio-demographic variables and cost-related non-adherence to medical care.