
Figures & data
Figure 1. Treatment transitions. Transitions between treatments were modeled annually and were only permitted in the directions of the arrows. Rectangular blue boxes represent initiating treatments considered in year 0. Grey ovals represent downstream treatments considered in years 1–5. Blue arrows represent the first transitions after the first model cycle (in year 0), and grey arrows represent downstream treatment transitions in subsequent cycles (years 1–5). SLT: selective laser trabeculoplasty.
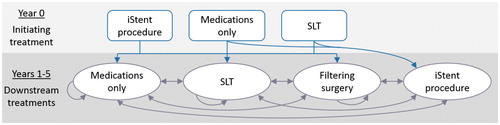
Table 1. Percentage of uncontrolled OAG patients receiving therapies.
Table 2. Use of concurrent and standalone medications.
Table 3. Inputs.
Figure 2. Cumulative costs of treatments over 5 years. SLT: selective laser trabeculoplasty.
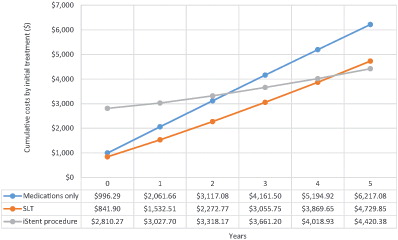
Table 4. Annual marginal costs.
Figure 3. Tornado diagram. (a) Incremental 5-year costs difference with the iStent procedure compared to SLT. (b) Incremental 5-year costs difference with the iStent procedure compared to medications only. SLT, selective laser trabeculoplasty. Dotted vertical line represents the base case result.
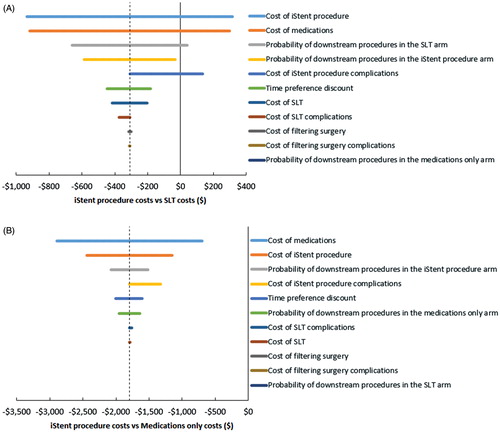
Table 5. Inputs uncertainty most influencing 5-year cumulative cost outcomes.