
Figures & data
Figure 1. Model structure.
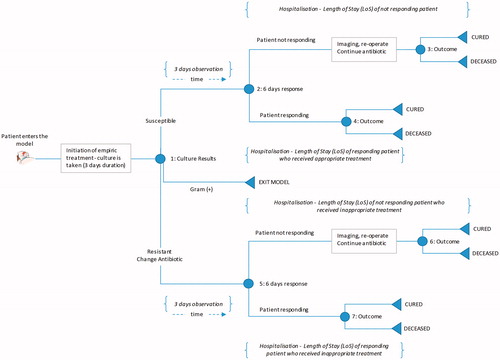
Figure 2. Treatment pathway diagram.
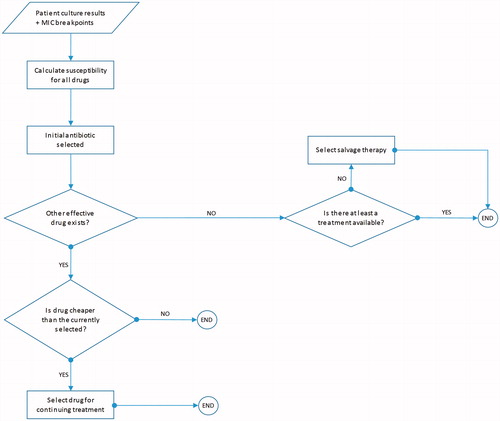
Table 1. Treatment pathway for patients with a gram-negative abdominal culture.
Table 2. Clinical and economic inputs.
Table 3. Results.
Figure 3. Ceftolozane/tazobactam vs piperacillin/tazobactam: influence of variables on ICER (cost per discounted QALY). ICER, Incremental cost-effectiveness ratio; QALY, Quality Adjusted Life Year; LoS, Length of Stay.
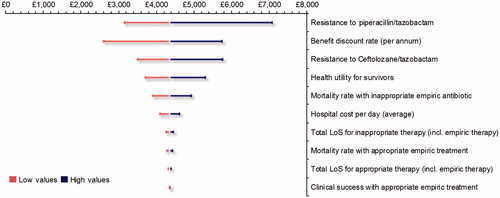
Figure 4. Cost-effectiveness plane. QALY, Quality Adjusted Life Year.
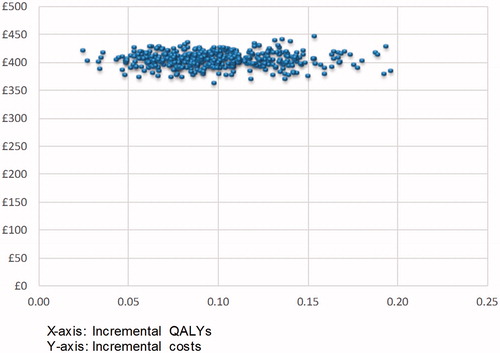
Figure 5. Cost-effectiveness acceptability curve. QALY, Quality Adjusted Life Year; WTP, Willingness to pay.
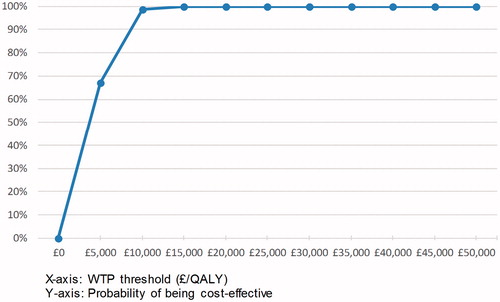
Table 4. Scenario analysis results.
Supplemental material