
Figures & data
Table 1. Study inclusion criteria applied when screening articles and abstracting data.
Figure 1. Flow diagram depicting the literature review process and studies identified. HTA, health technology assessment.
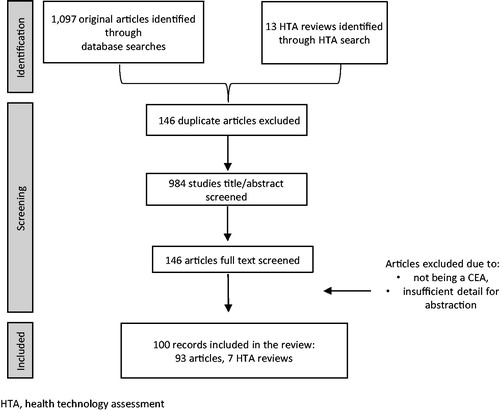
Table 2. Results: frequency of statistically significant mortality data utilized within cost effectiveness analyses of lipid-lowering therapies.
Figure 2. Results: source of mortality data and use of composite and individual end-points within CEA that incorporated a direct effect.
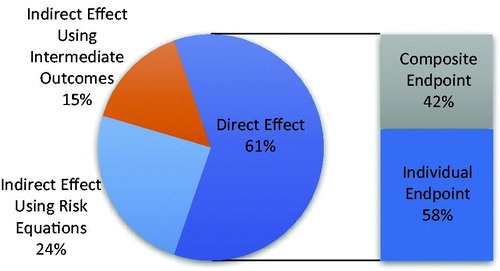
Table 3. Results: quantitative assessment of mortality data sources and format of data used among studies modeling a direct mortality effect.
Table 4. Sensitivity analysis of studies that incorporated a direct CVD mortality benefit.
Supplemental material