1,207
Views
13
CrossRef citations to date
0
Altmetric
Oncology

Cost drivers for breast, lung, and colorectal cancer care in a commercially insured population over a 6-month episode: an economic analysis from a health plan perspective

, & ORCID Icon
Pages 1018-1023 | Received 15 Mar 2017, Accepted 29 May 2017, Published online: 03 Jul 2017

Figures & data

Figure 1. Flow diagram of study inclusion and exclusion criteria.

Figure 1. Flow diagram of study inclusion and exclusion criteria.

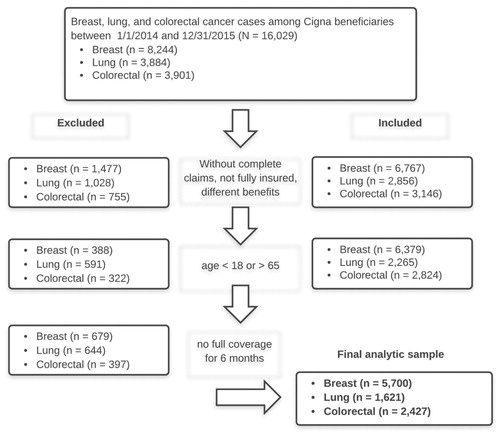
Table 1. Sample demographic and clinical characteristics.

Table 2. Costs by cancer type, facility type, year, and setting.

Table 3. Multivariable regression model maximum likelihood parameter estimates, cost drivers in breast cancer (n = 5,692).

Table 4. Multivariable regression model maximum likelihood parameter estimates, cost drivers in lung cancer (n = 1,618).

Table 5. Multivariable regression model maximum likelihood parameter estimates, cost drivers in colorectal cancer (n = 2,423).

Table 6. Distribution of medical costs.

Reprints and Corporate Permissions

Please note: Selecting permissions does not provide access to the full text of the article, please see our help page How do I view content?

To request a reprint or corporate permissions for this article, please click on the relevant link below:

Academic Permissions

Please note: Selecting permissions does not provide access to the full text of the article, please see our help page How do I view content?

Obtain permissions instantly via Rightslink by clicking on the button below:

If you are unable to obtain permissions via Rightslink, please complete and submit this Permissions form. For more information, please visit our Permissions help page.