Figures & data
Figure 1. Decision tree used to model the economic analyses. Abbreviations. HAL, Haloperidol long acting injectable; RIS, risperidone long acting injectable; OLZ, olanzapine oral.
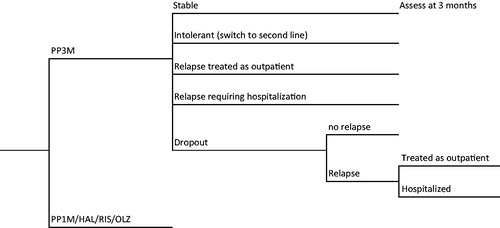
Table 1. Clinical inputs and their sources.
Table 2. List of DRG codes in The Netherlands used to reimburse treatments for schizophrenia and other major psychoses, time allotments and reimbursement amounts for each DRG category.
Table 3. Costs of resources used in the analysisTable Footnotea.
Table 4. Utilities used in the research.
Table 5. Outcomes from the pharmacoeconomic analysis.
Figure 2. Scatterplot of cost-utility results between PP3M and PP1M using (a) DRGs and (b) microcosting.
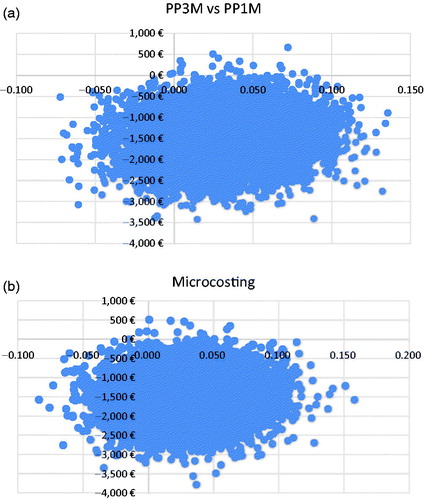
Table 6. Validation of the cost-utility model.
Figure A1. PP3M vs RIS-LAT.
Figure A2. PP3M vs HAL-LAT.
Figure A3. PP3M vs oral olanzapine.