Figures & data
Figure 1. Respondent flow diagram for the study. MS, Multiple sclerosis; NHWS, National Health and Wellness Survey.
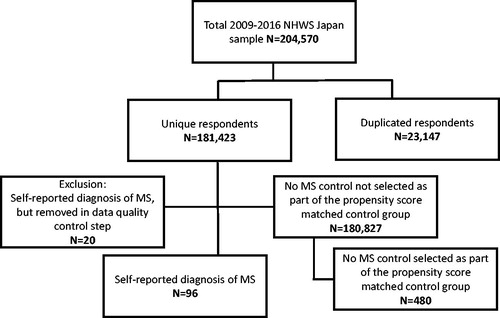
Table 1. Description of primary diagnoses in NHWS contributing to CCI.
Table 2. Comparison of respondent characteristics between respondents with MS and controls.
Figure 2. Comparison of 8-item SF-36v2 health profile scores between diagnosed MS respondents to the matched control group. 95% confidence intervals are presented, and all p-values are <.001. Only respondents taking NHWS surveys in 2010–2014 and 2016 were included. MS, Multiple sclerosis.
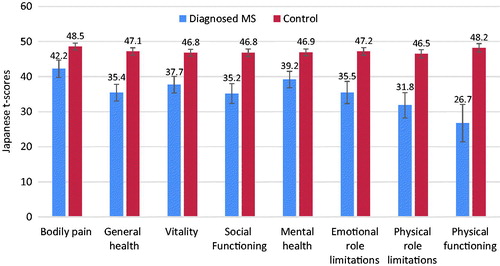
Table 3. Comparison of health-related quality-of-life outcomes between MS patients and controls.
Figure 3. Comparison of health resource utilization and costs between MS patients and matched controls. 95% confidence intervals are presented, and p-values significant at <.001 are indicated with an *. MS, Multiple sclerosis.
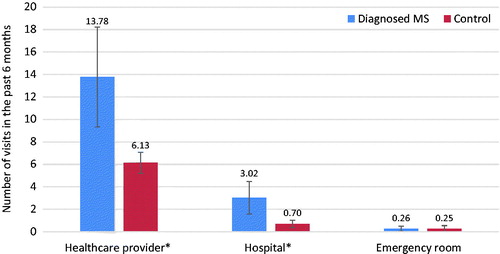
Figure 4. Comparison of work productivity and activity impairment between MS patients and controls. 95% confidence intervals are presented, and all p-values <.001. MS, Multiple sclerosis. Only respondents currently employed (full-time, part-time, or self-employed) provided data with respect to absenteeism, presenteeism, and overall work impairment.
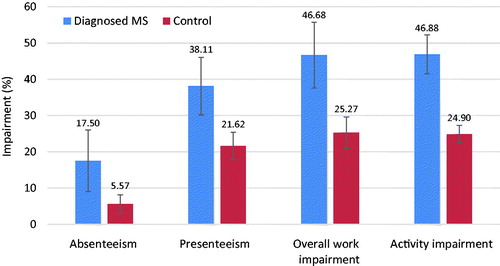
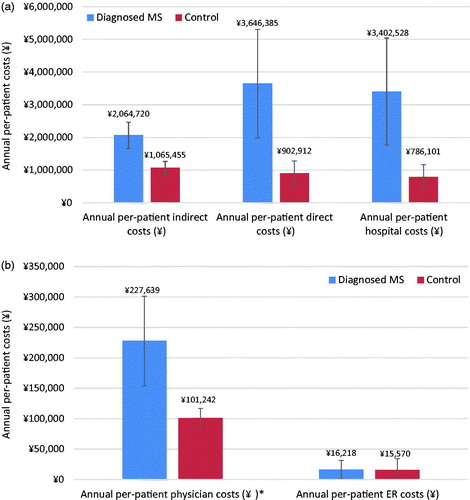
Figure 5. (a) Comparison of annual per-patient indirect, direct, and hospital costs. 95% confidence intervals are presented, and all p-values <.001. (b) Comparison of annual per-patient physician costs and ER costs. 95% confidence intervals are presented, and p-values significant at .001 are indicated with an *. ER, Emergency room; MS, Multiple sclerosis.