
Figures & data
Figure 1. Sample selection for OA cohort. OA cohort patients were required to have at least two OA diagnoses codes (the ICD-9-CM code 715.xx) on different dates. Patients must have an OA diagnosis, defined as the index date, with 1 year of continuous eligibility prior to and 1 month after the OA diagnosis. One year prior to OA diagnosis was defined as baseline period and 1 year following the OA diagnosis as follow-up period. Further, patients require a second OA diagnosis within 1 year of the index date, but not within 15 days of the index diagnosis. OA, osteoarthritis; ICD-9-CM, International Classification of Diseases, Ninth Revision, Clinical Modification.
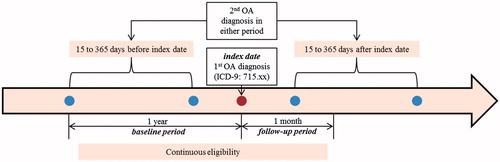
Table 1. Baseline characteristics among 18–64 year olds.
Table 2. One-year healthcare resource utilization among 18–64 year olds with or without OA.Table Footnotea
Table 3. One-year healthcare costs among 18–64 year olds with or without OA.Table Footnotea
Figure 2. Total 1-year medical, inpatient, outpatient, and pharmacy costs by joint location (knee [n = 87,271], hip [n = 19,953], hand [n = 15,670], and spine [n = 12,496]) among OA patients. All costs were inflated to 2016 USD using annual medical care consumer price index (CPI) data from the Bureau of Labor Statistics. Total medical costs are equal to the sum of inpatient, outpatient, and emergency department costs. OA, osteoarthritis.
![Figure 2. Total 1-year medical, inpatient, outpatient, and pharmacy costs by joint location (knee [n = 87,271], hip [n = 19,953], hand [n = 15,670], and spine [n = 12,496]) among OA patients. All costs were inflated to 2016 USD using annual medical care consumer price index (CPI) data from the Bureau of Labor Statistics. Total medical costs are equal to the sum of inpatient, outpatient, and emergency department costs. OA, osteoarthritis.](/cms/asset/c24703fb-6442-4ef8-9b1a-3bdf746a6b14/ijme_a_1377717_f0002_c.jpg)
Figure 3. Total 1-year medical, inpatient, outpatient, and pharmacy costs by age group (18–44 years old [n = 27,122] and 45–64 years old [n = 172,417]) among OA patients. All costs were inflated to 2016 USD using annual medical consumer price index (CPI) data from the Bureau of Labor Statistics. Total medical costs are equal to the sum of inpatient, outpatient, and emergency department costs. OA, osteoarthritis.
![Figure 3. Total 1-year medical, inpatient, outpatient, and pharmacy costs by age group (18–44 years old [n = 27,122] and 45–64 years old [n = 172,417]) among OA patients. All costs were inflated to 2016 USD using annual medical consumer price index (CPI) data from the Bureau of Labor Statistics. Total medical costs are equal to the sum of inpatient, outpatient, and emergency department costs. OA, osteoarthritis.](/cms/asset/97b16e54-ebd2-4421-8f7f-751a822a8ec6/ijme_a_1377717_f0003_c.jpg)