Figures & data
Figure 1. Budget impact model schematic. Abbreviations. IDeg, insulin degludec; IGlar, insulin glargine; T1D, type 1 diabetes; T2D, type 2 diabetes.
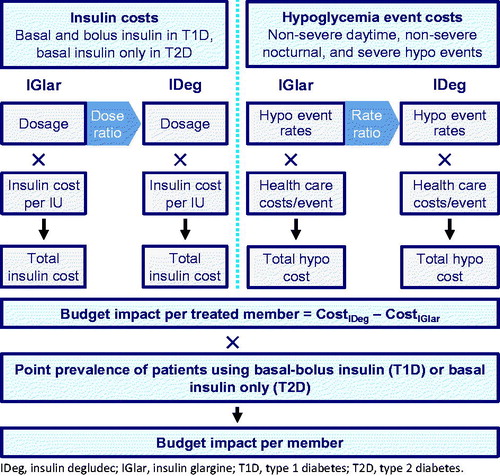
Table 1. Hypoglycemia rates in patients with type 1 or type 2 diabetes in the reference case analyses expressed in events per 100 patient years.
Table 2. Basal and bolus insulin doses and costs associated with insulin glargine and insulin degludec in the type 1 and type analyses.
Table 3. Severe hypoglycemia cost estimates for patients with type 1 or type 2 diabetes in the US.
Figure 2. Estimate of the number of (A) basal-bolus insulin users with type 1 diabetes and (B) basal-only insulin users with type 2 diabetes in 1,000,000 member health insurance plans.
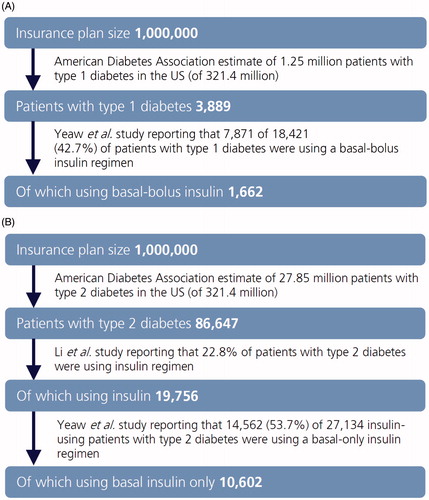
Table 4. Breakdown of treatment costs in the reference case analysis.
Table 5. Per treated member per year and per member per month costs of insulin degludec relative to insulin glargine.
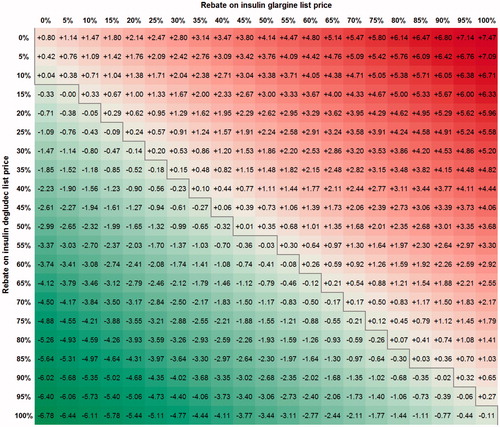
Figure 3. Per member per month incremental cost of insulin degludec relative to insulin glargine in patients with type 1 diabetes in the US (USD).
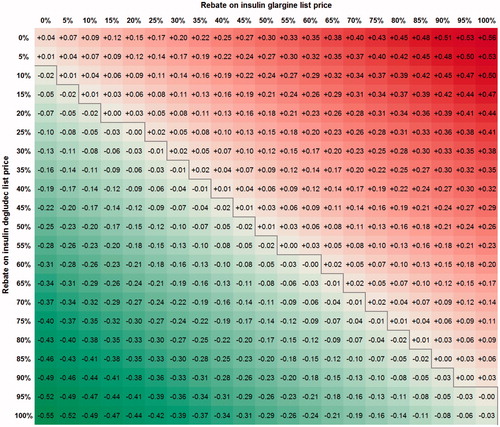
Figure 4. Per member per month incremental cost of insulin degludec relative to insulin glargine in patients with type 2 diabetes in the US (USD).