Figures & data
Table 1. Follow-up month comparisons by site-of-care, all cancers.
Table 2. Site-of-care comparisons of first-line therapy drug classes by cancer type.
Table 3. Site-of-care comparisons of duration of first-line therapy in days among cancer types.
Table 4. Site-of-care comparisons of number of infusions during first-line therapy among cancer types.
Table 5. Baseline comparisons by site-of-care, all cancers.
Figure 1. Patient selection and attrition table. Abbreviations. eBC, Early stage breast cancer; NHL/CLL, Non-Hodgkin’s Lymphoma or Chronic Lymphocytic Leukemia; MAPD, Medicare advantage with prescription drug coverage; AL, Alabama; NE, New England; DE, Delaware; NCCN, National Comprehensive Cancer Network; mBC, Metastatic breast cancer; mLC, Metastatic lung cancer; mCRC, metastatic colorectal cancer.
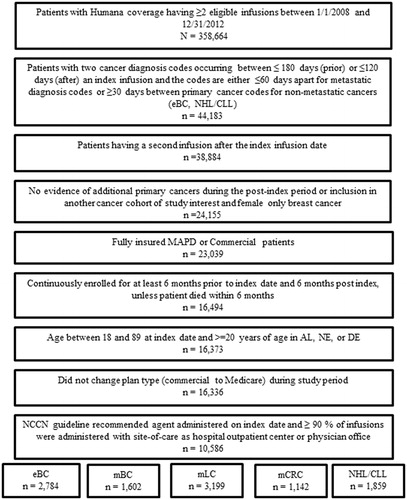
Table 6. Site-of-care comparisons of quality of care at end of life among cancer types for Medicare patients.
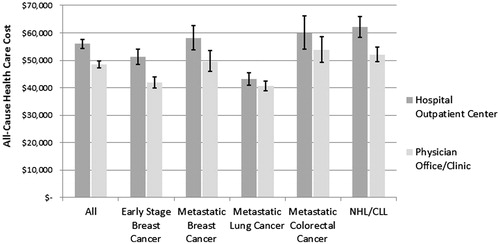
Figure 2. Site-of-care comparisons of adjusteda all-cause total healthcare costs by cancer type 6 months post-index.aGeneralized linear model estimations of mean total healthcare cost (sum of medical and pharmacy costs) (distribution = gamma, link function = log) with covariate adjustments for age, sex, Deyo Charlson Comorbidity Index, site-of-care, geographic region, and total medical costs in 6 month pre-index period.