Figures & data
Table 1. Annual US inpatient angioplasties, MARCE adverse events, and costs.
Table 2. Frequency and costs of inpatient angioplasties with and without MARCE adverse events (by hospital type).
Table 3. Estimated annual aggregate, per hospital and per procedure global savings associated with adoption of an “IOCM only” strategy vs “LOCM only” strategy for inpatient angioplasties.
Table 4. Relative impact of key determinants on global hospital cost savings associated with adoption of an “IOCM only” strategy vs “LOCM only” strategy across hospital sub-groups.
Figure 1. Cost savings: one way sensitivity analyses.
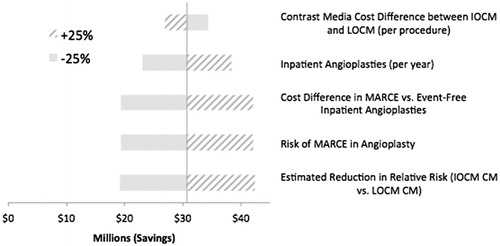
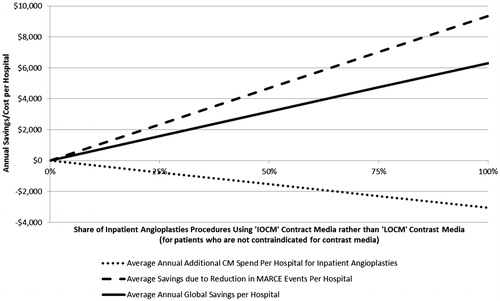
Figure 2. Annual per hospital MARCE savings, contrast media cost and global savings vs share of inpatient angioplasty procedures with IOCM.