
Figures & data
Table 1. Patient characteristics in the selected studies.
Table 2. Score distributions on the AcroQoL and EQ-5D.
Table 3. Regression coefficients for the best four models (Model 11 was the model finally selected).
Table 4. Analysis of residuals in the different models tested.
Figure 1. Scatterplot of residuals in the selected model.
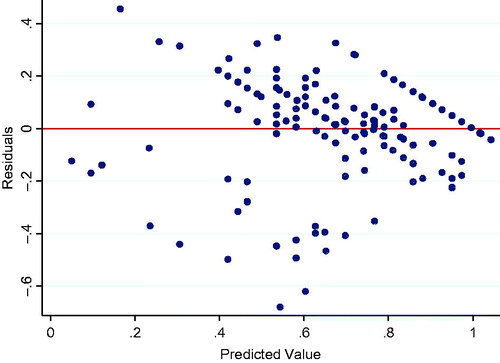
Table 5. Confirmatory analysis for the different models tested.