Figures & data
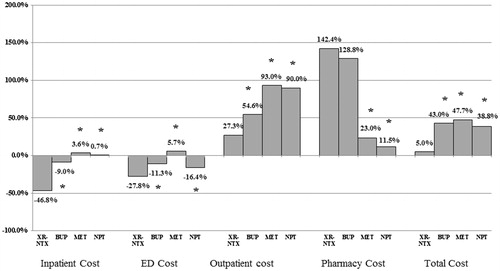
Figure 1. Patient attrition.
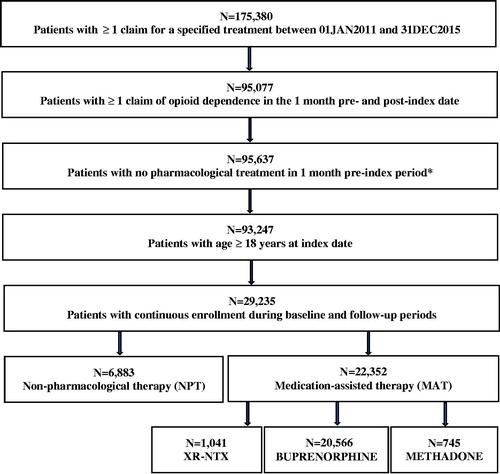
Table 1. Baseline demographics and clinical characteristics.
Table 2. Healthcare resource utilization during baseline and follow-up periods.
Table 3. Healthcare costs during baseline and follow-up periods.
Table 4. Treatment patterns during the follow-up period.
Figure 2. Difference in healthcare costs during baseline and follow-up periods: between groups comparisons. Abbreviations. XR-NTX, extended-release naltrexone; BUP, Buprenorphine; MET, Methadone; NPT, Non-pharmacological therapy; ED, Emergency department. Reference category: XR-NTX. *denote significant difference when compared with XR-NTX at p < .05. p-values were based on generalized linear models (GLM) with a log-link function and gamma distribution after controlling for baseline covariates.