Figures & data
Figure 1. Depiction of model health states. 1L, first line; 2L+, second line or later; Abbreviations. MM, multiple myeloma; OFF SRE Prev Tx, patients not receiving treatment to prevent SREs; ON SRE Prev Tx, patients receiving treatment to prevent SREs; SRE, skeletal-related event; Tx, treatment.
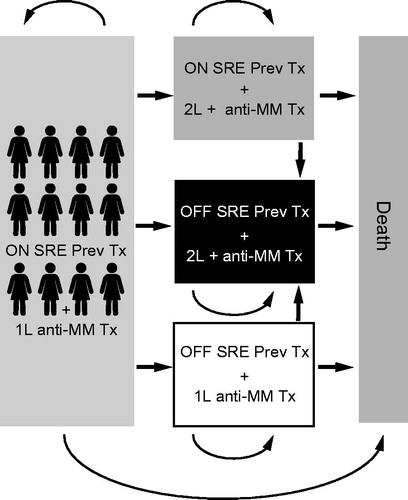
Table 1. SRE counts and distributions from the 20090482 study.
Table 2. SRE rates from the 20090482 study.
Table 3. SRE rates from the 20090482 study (differential rates before and 15 months after the start of SRE preventive treatment).
Figure 2. Progression-free survival parametric model (unrestricted generalized gamma distributions compared with Kaplan–Meier curves). Abbreviations. KM, Kaplan–Meier; MM, multiple myeloma; PFS, progression-free survival.
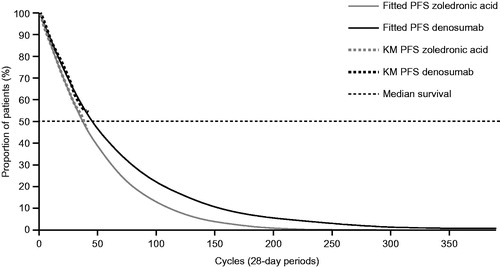
Table 4. Utility decrements.
Table 5. Summary of all cost inputs.
Figure 3. Net monetary benefit of denosumab vs zoledronic acid in patients with multiple myeloma from (a) the societal perspective and (b) the payer perspective. Societal perspective included SRE direct costs (hospital, outpatient, long-term care and hospice, strong opioid, emergency department visits, physical therapy, and skilled nursing facility), QALY monetization and direct non-medical (driving and parking, caregiver), and indirect costs (short-term disability and productivity loss). Payer perspective included SRE direct costs (hospital, outpatient, long-term care and hospice, strong opioid, emergency department visits, physical therapy, and skilled nursing facility) and QALY monetization. Assumed 50% MM treatment cost offsets and 35% patients eligible for short-term disability and productivity loss. Drug acquisition costs were based on average sales prices. Abbreviations. MM, multiple myeloma; NMB, net monetary benefit; QALY, quality-adjusted life year; SAE, serious adverse event; SRE, skeletal-related event; ZA, zoledronic acid.
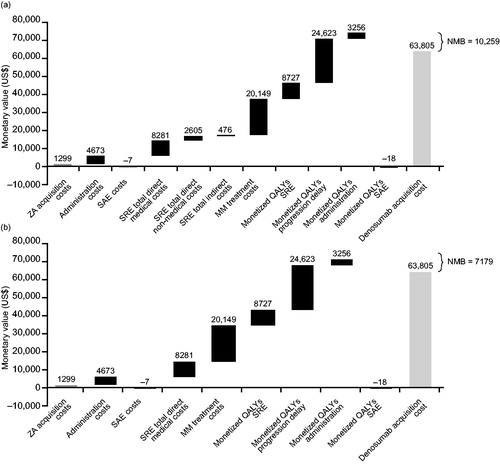
Table 6. Costs by category (discounted).
Table 7. Comparator incremental cost-effectiveness ratio results from the societal perspective.
Table 8. Comparator incremental cost-effectiveness ratio results from the payer perspective.
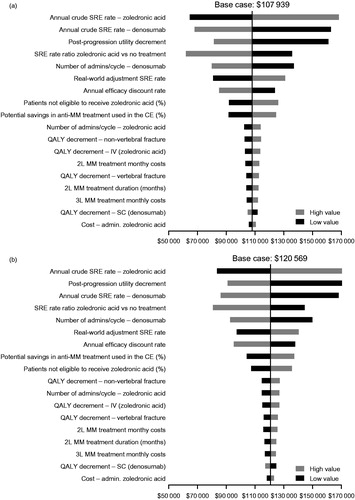
Figure 4. One-way deterministic sensitivity analyses of key variables from (a) the societal perspective and (b) the payer perspective. Ranges for parameters used were as follows: annual efficacy discount rate = 0.00–0.05; percentage of patients not eligible to receive zoledronic acid = 0.05–0.15; annual crude SRE rate of denosumab = 0.55–0.64; annual crude SRE rate of zoledronic acid = 0.58–0.67; real world adjustment SRE rate = 2.01–4.01; SRE rate ratio for zoledronic acid vs no treatment = 0.42–0.82; zoledronic acid cost of administration = 189–231; denosumab number of cycles = 0.79–0.97; zoledronic acid number of cycles = 0.77–0.94; post-progression utility decrement = 0.57–0.72; QALY decrement SC = 0.0009–0.0014; QALY decrement IV = 0.0017–0.0025; QALY decrement vertebral fracture =0.05–0.15; QALY decrement non-vertebral fracture = 0.05–0.15; MM second-line treatment duration = 7.66–9.36; percentage of potential savings in anti-MM treatment used in the cost-effectiveness analysis = 0.40–0.60; second-line MM treatment monthly costs = 16,430–20,081; third-line MM treatment monthly costs = 16,530–20,204. Abbreviations. 2L, second line; 3L, third line; CE, cost-effectiveness analysis; IV, intravenous; MM, multiple myeloma; RR, risk ratio; SC, subcutaneous injection; SRE, skeletal-related event; QALY, quality-adjusted life-year.