
Figures & data
Figure 1. Sample attrition, by reason.
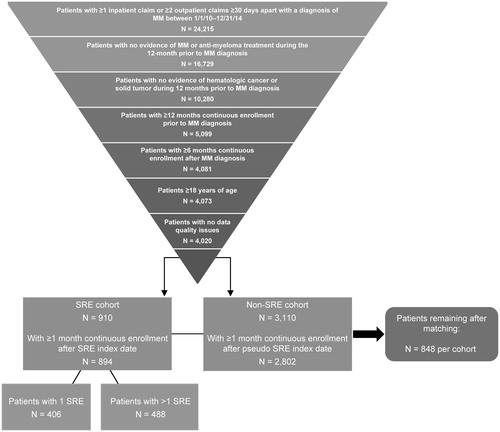
Table 1. Baseline clinical characteristics in SRE vs non-SRE patients after propensity score matching.
Figure 2. Healthcare costs in skeletal-related events (SRE) vs non-SRE patients (USD, PPPY (per-patient-per-year)). * Wilcoxon tests were used to compare groups.
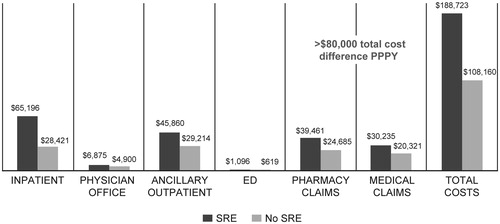
Table 2. Healthcare resource use in propensity score matched SRE vs non-SRE patients.Table Footnote*