
Figures & data
Table 1. Strategies compared in the model.
Figure 1. Model structure. Figure reprinted with permission of publisher from: ‘Cost?effectiveness of vaccinating adults with the 23-valent pneumococcal polysaccharide vaccine (PPV23) in Germany’ by Yiling Jiang, Aline Gauthier, Lieven Annemans, Mark van der Linden, Laurence Nicolas-Spony & Xavier Bresse, in Expert Review of Pharmacoeconomics & Outcomes Research, January 9th 2014, Taylor & Francis Ltd.
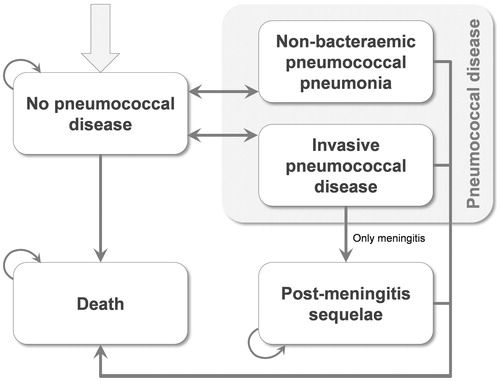
Table 2. Clinical parameters related to IPD and NBPP.
Table 3. Vaccine effectiveness.
Table 4. Utility.
Table 5. Costs.
Table 6. Base case results: summary effectiveness and costs (in thousands for costs, QALYs and life years).
Table 7. Base case results: summary of incremental costs and effectiveness (in thousands for costs and QALYs; all discounted).Table Footnotea
Figure 2. Tornado diagram for DSA results (Strategy 2 vs Strategy 1). Abbreviations. Excl., excluding; ICER, incremental cost-effectiveness ratio; IPD, invasive pneumococcal disease; NBPP, non-bacteremic pneumococcal pneumonia; PPV23, 23-valent pneumococcal polysaccharide vaccine; QALY, Quality adjusted life years.
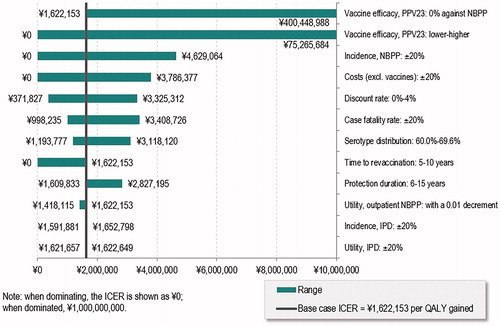
Table 8. DSA results.
Figure 3. Probabilistic sensitivity analysis: cost-effectiveness plane. Abbreviation. QALY, Quality adjusted life years.
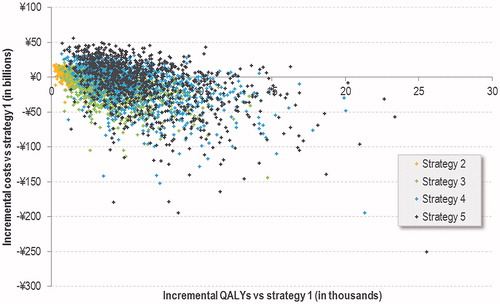
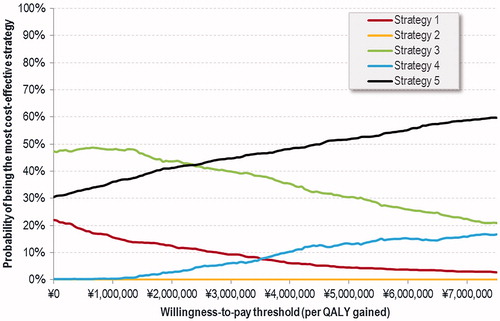
Figure 4. Probabilistic sensitivity analysis: cost-effectiveness acceptability curves. Abbreviation. QALY, Quality adjusted life years.
Data availability statement
The data that support the findings of this study are available from the corresponding author, XY, upon reasonable request.