Figures & data
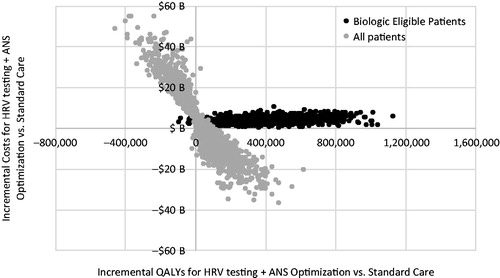
Figure 1. Decision tree of RA patient journey with current standard care (A), and with HRV testing for biologic-eligible patients (B). *Disease control defined as ACR70. References: (a) Ollendorf et al.Citation28, (b) Kim et al.Citation30, (c) Holman and NgCitation21.
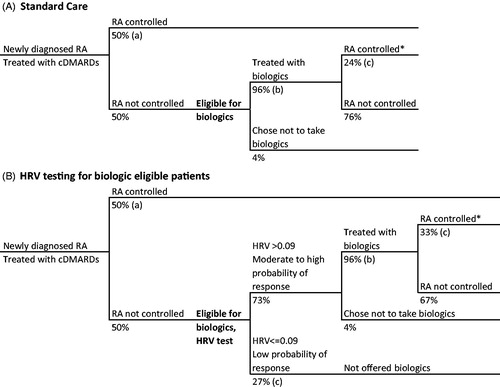
Table 1. Costs data inputs and sources.
Figure 2. RA patient journey with HRV testing and ANS optimization for biologic-eligible patients. *Disease control defined as ACR70. References: (a) Ollendorf et al.Citation28, (b) Holman and NgCitation21, (c) Kim et al.Citation30, (d) Holman and NgCitation20,Citation24.
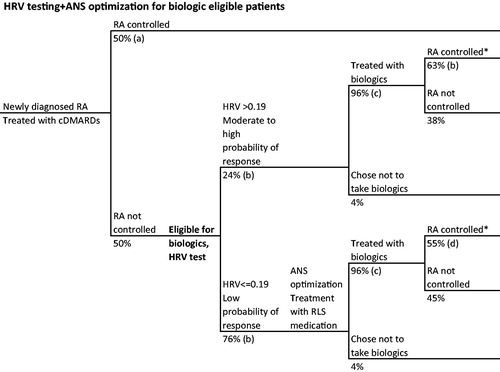
Figure 3. Hypothetical RA patient journey with HRV tasting and ANS optimization for all patients. *Disease control defined as ACR70. References: (a) Holman and NgCitation21, (b) Holman and NgCitation20,Citation24, (c) Kim et al.Citation30.
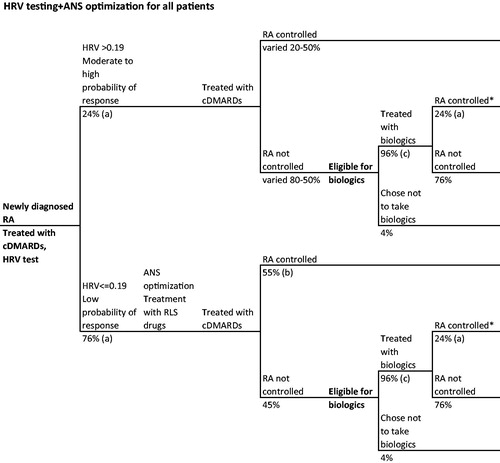
Table 2. Results for HRV testing compared to standard care for patients with moderate-to-severe RA eligible for biologic treatment.
Table 3. Results for HRV testing + ANS optimization compared to standard care for patients with moderate-to-severe RA in the US.
Figure 4. Tornado diagram for one-way sensitivity analysis for the ICER for HRV testing + ANS optimization for biologic eligible patients (top), and for the incremental costs of HRV testing + ANS optimization for all patients (bottom), compared to standard care.
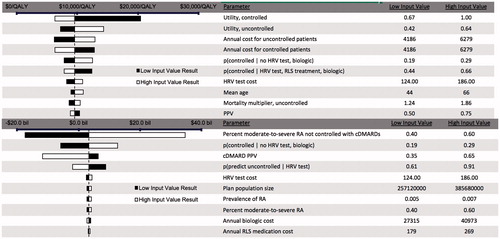
Figure 5. Results of the probabilistic sensitivity analysis: incremental costs and incremental QALYs for the US population for HRV testing + ANS optimization for biologic-eligible and for all patients compared to standard care.