Figures & data
Table 1. Demographic characteristics for the biologic cohort, overall and stratified by disease severity.
Figure 1. Median number of outpatient encounters (all-cause and psoriasis-related) during the follow-up period, stratified by disease severity.
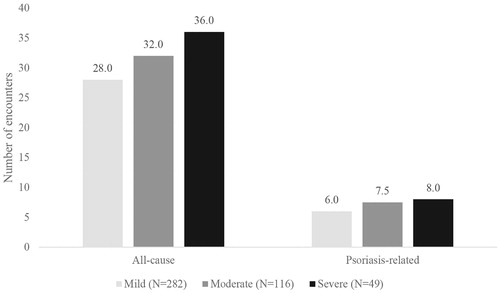
Figure 2. Proportion of prescription medication claims that were psoriasis-related during the follow-up period, stratified by disease severity.
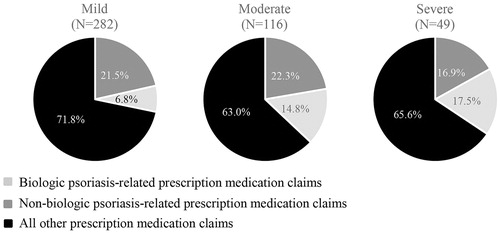
Table 2. Healthcare resource utilization during the follow-up period, overall and stratified by disease severity.
Figure 3. Median total and pharmacy costs (all-cause and psoriasis-related) during the follow-up period, stratified by disease severity.
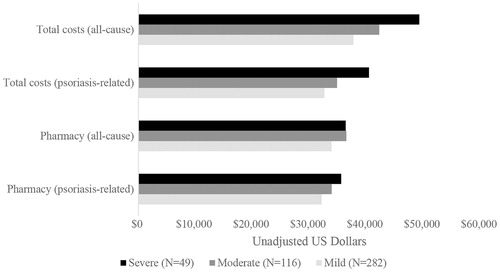
Table 3. Healthcare resource costs during the follow-up period, overall and stratified by disease severity (payer and patient combined).
Table 4. Healthcare resource costs during the follow-up period, overall and stratified by disease severity (payer only).
Table 5. Healthcare resource costs during the follow-up period, overall and stratified by disease severity (patient only).
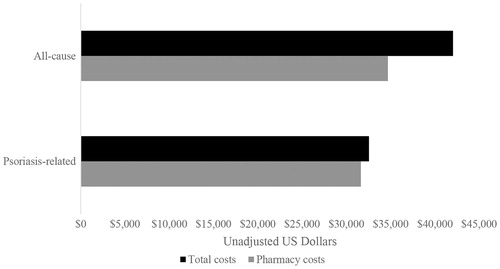
Figure 4. Average total healthcare and pharmacy costs (all-cause and psoriasis-related) during the follow-up period (n = 2,130).