573
Views
5
CrossRef citations to date
0
Altmetric
Oncology

First-line systemic treatment adherence, healthcare resource utilization, and costs in patients with gastrointestinal neuroendocrine tumors (GI NETs) in the USA

, , , &
Pages 821-826 | Received 08 Dec 2017, Accepted 03 May 2018, Published online: 25 May 2018

Figures & data

Figure 1. Patient identification. There were 2,900 and 2,453 GI NET patients who also had a claim for pharmacologic treatment in the MarketScan and PharMetrics databases, respectively. After excluding patients who had treatment during a 6-month pre-index period (and, therefore, were considered to be continuing, rather than initiating, treatment); received treatment before receiving a diagnosis of GI NET; were <18 years old; or were not continuously enrolled in the 6-month pre-index period, there remained 2,258 newly-treated GI NET patients who were included in the study. aSomatostatin analogs (SSA), targeted therapy, cytotoxic chemotherapy, or interferon; b324 (34.8%) within 3 months, and 516 (55.4%) within 6 months; c249 (35.0%) within 3 months, and 380 (53.4%) within 6 months.

Figure 1. Patient identification. There were 2,900 and 2,453 GI NET patients who also had a claim for pharmacologic treatment in the MarketScan and PharMetrics databases, respectively. After excluding patients who had treatment during a 6-month pre-index period (and, therefore, were considered to be continuing, rather than initiating, treatment); received treatment before receiving a diagnosis of GI NET; were <18 years old; or were not continuously enrolled in the 6-month pre-index period, there remained 2,258 newly-treated GI NET patients who were included in the study. aSomatostatin analogs (SSA), targeted therapy, cytotoxic chemotherapy, or interferon; b324 (34.8%) within 3 months, and 516 (55.4%) within 6 months; c249 (35.0%) within 3 months, and 380 (53.4%) within 6 months.

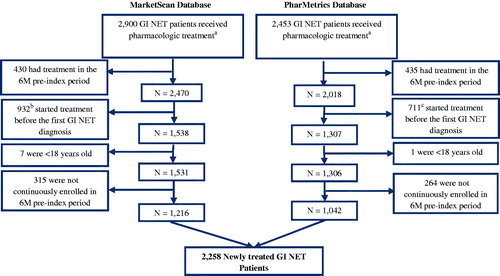
Table 1. First-line treatment in patients with 1 or 2 years post-index enrollment.

Table 2. Demographic characteristics in patients with 1-year post-index continuous enrollment.

Table 3. All-cause healthcare resource utilization in patients with 1-year post-index continuous enrollment.

Table 4. All-cause healthcare costs in patients with 1-year post-index continuous enrollment.

Table 5. Annual healthcare resource utilization and cost in year 1 and 2 among patients with 2-years post-index continuous enrollment.

Reprints and Corporate Permissions

Please note: Selecting permissions does not provide access to the full text of the article, please see our help page How do I view content?

To request a reprint or corporate permissions for this article, please click on the relevant link below:

Academic Permissions

Please note: Selecting permissions does not provide access to the full text of the article, please see our help page How do I view content?

Obtain permissions instantly via Rightslink by clicking on the button below:

If you are unable to obtain permissions via Rightslink, please complete and submit this Permissions form. For more information, please visit our Permissions help page.