
Figures & data
Figure 1. Study design.
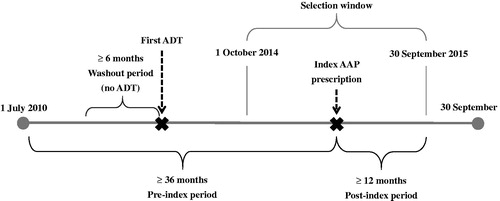
Figure 2. Patient selection.
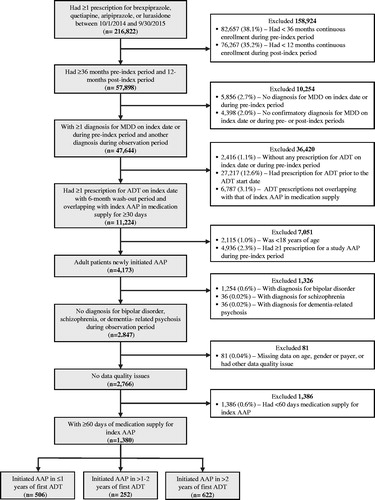
Table 1. Patient characteristics.
Table 2. Treatment history.
Figure 3. Unadjusted pre–post differences in healthcare resource utilization. *indicates a post–pre difference that was statistically significantly different from zero (p-value <.05). †indicates a post–pre difference that was statistically significantly different from that of cohort Y1 (p-value <.05).
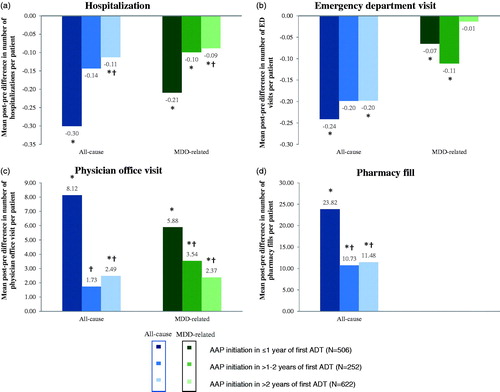
Table 3. Unadjusted utilization of healthcare resources.
Figure 4. Unadjusted pre–post differences in healthcare costs. *indicates a post–pre difference that was statistically significantly different from zero (p-value <.05). †indicates a post–pre difference that was statistically significantly different from that of cohort Y1 (p-value <.05).
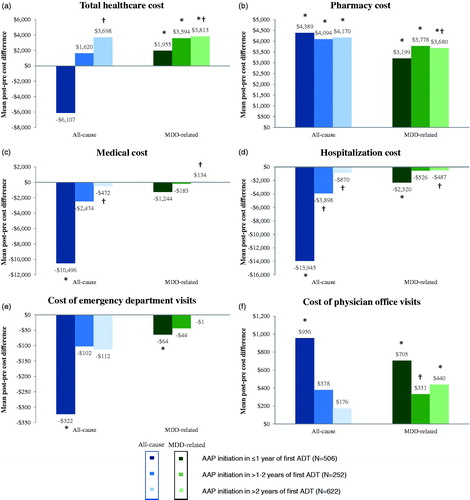
Table 4. Unadjusted costs of healthcare services.