Figures & data
Figure 1. Diagram of model structure.
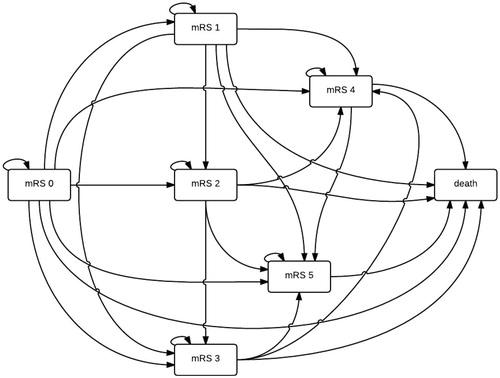
Table 1. Modified Rankin scale health states description, utilities, and relative risk of dying related to each mRS state.
Table 2. Parameters’ summary.
Table 3. Treatment costs of stent retriever and IV-tPA.
Table 4. Treatments’ total costs, total QALYs, incremental cost-effectiveness ratio, and net monetary benefit.
Figure 2. Incremental cost-effectiveness ratio trend over a 5-year time horizon.
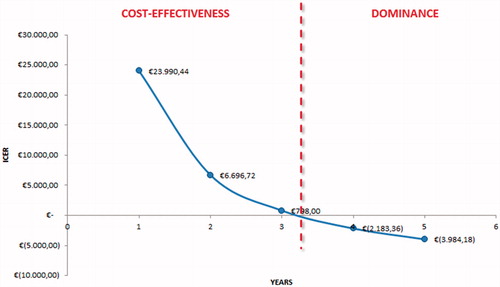
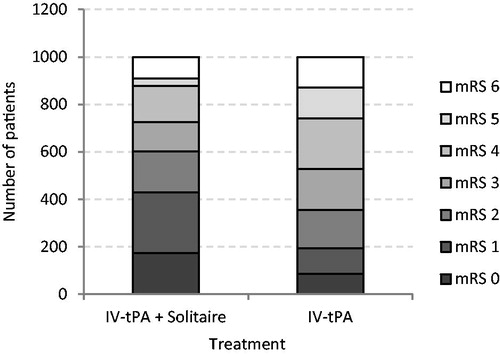
Table 5. Patients’ distribution among health states induced by MT plus IV t-PA and IV t-PA alone.
Table 6. Total costs of MT plus IV t-PA and IV t-PA alone per level of morbidity.
Figure 3. One-way sensitivity analysis—Tornado Graph.
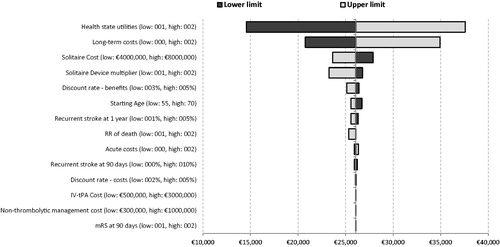
Figure 4. Cost-effectiveness plane—5-year time horizon.
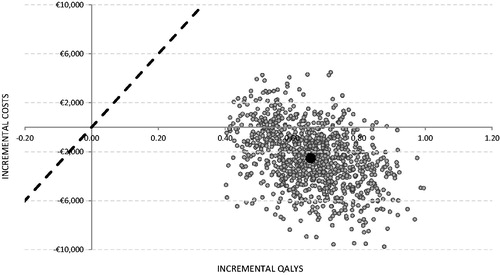
Figure 5. Cost-effectiveness acceptability curve—5-year time horizon.
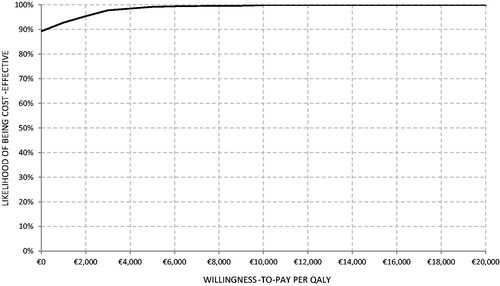
Table A1. Transition probabilities of recurrent stroke for IV t-PA alone.
Table A2. Transition probabilities of recurrent stroke for IV t-PA + Solitaire.
Figure A1. Morbidity at 90 days from the acute event for IV t-PA + Solitaire and IV t-PA alone.