
Figures & data
Figure 1. Sequence of the four questionnaires in the form administered to the patients. *DBQ was only used at baseline (T0).
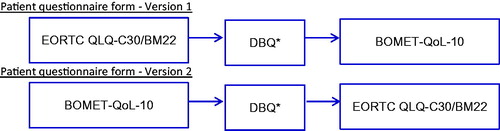
Table 1. German version of the BOMET-QoL-10 questionnaire.
Table 2. Interpretation of correlation coefficients.
Table 3. Effect size index (r) and respective value for small, medium, and large effects.
Table 4. Characteristics of patients at inclusion.
Figure 2. The BOMET-QoL-10 mean score and the scores of EORTC QLQ-BM22 (four different scales) depicted at inclusion, T1, T2, and T3.
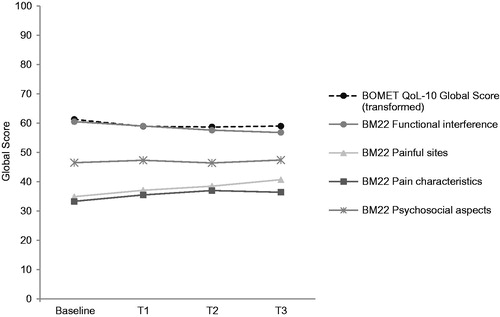
Figure 3. Sensitivity of BOMET-QoL-10 to change in EORTC QLQ-BM22 scores. Corresponding changes in BOMET-QoL-10 mean scores are shown for patient groups who showed increased, stable (unchanged scores), or decreased EORTC QLQ-BM22 scores between the last available assessment and T0. An increased EORTC QLQ-BM22 score was defined as a ≥ 20 points higher score than T0, and a decreased score was defined as a ≥10 points lower score as compared to T0.
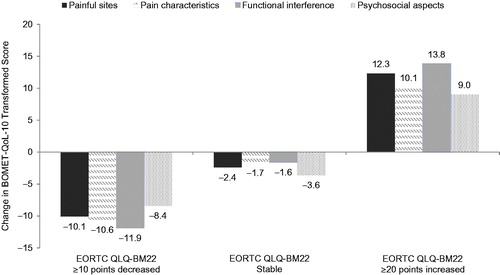
Table 5. Difference in BOMET-QoL-10 score compared to earlier time points.
Table 6. Linear regression analysis: association of patient characteristics with BOMET-QoL-10 at inclusion.