
Figures & data
Figure 1. Diagram of cost-effectiveness model structureCitation6. Abbreviation. AEs, adverse effects.
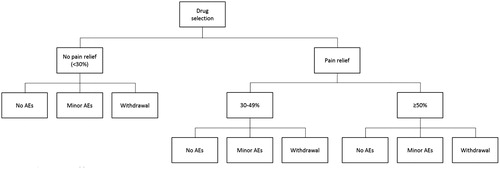
Table 1. Model parameters.
Table 2. Model scenario analyses results.
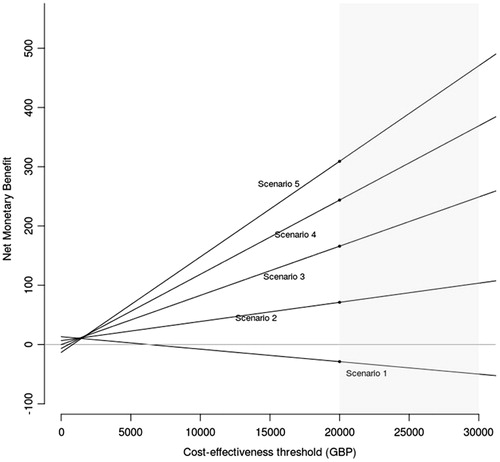
Figure 2. Net monetary benefit of the hypothetical treatment relative to pregabalin. Abbreviation. GBP, Great British Pounds.
Data availability statement
The data that support the findings of this study are openly available in Zenodo at doi.org/10.5281/zenodo.1212328.