Figures & data
Table 1. Unit costs and units required for drug acquisition, drug administration, and monitoring.
Table 2. Base case results at 5 years.
Figure 1. A. Undiscounted costs per average patient per year for alemtuzumab, fingolimod and natalizumab. Average alemtuzumab costs decrease sharply after 2 years, because of a decreasing number of patients requiring courses. B. Cumulative discounted costs per average patient for alemtuzumab, fingolimod and natalizumab after 1 to 5 years. Alemtuzumab costs intersect with natalizumab costs at approximately 2.8 years, and with fingolimod costs at 3.3 years.
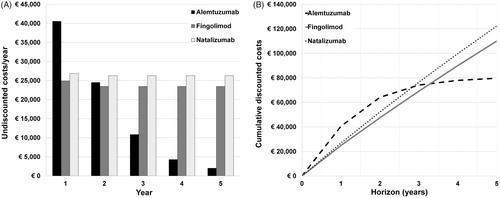
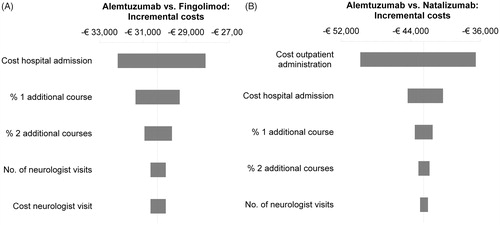
Figure 2. Overview of the 5-year results of the deterministic univariate sensitivity analyses of alemtuzumab versus fingolimod (A) and natalizumab (B). The bars represent the impact on incremental (discounted) costs when varying the parameters one by one to the lower and upper bounds of their 95% CIs.